

EduNinja

Edexcel IGCSE Math A Higher 6.1.HA histograms

Edexcel IGCSE Math A Higher 6.1.HA histograms
Edexcel IGCSE Math A syllabusMath A 4MA1First assessment 2018

Practise histogram questions by using frequency density, class width and area to complete bars or estimate frequencies accurately.

How this is tested

  • Calculate frequency density from frequency and class width before drawing bars.
  • Use histogram area to find a missing frequency or total for an interval.
  • Interpret continuous grouped-data contexts such as times, heights or weights.

Question 21

The histogram shows information about the times, in minutes, that some trains arrived late at a station one day.
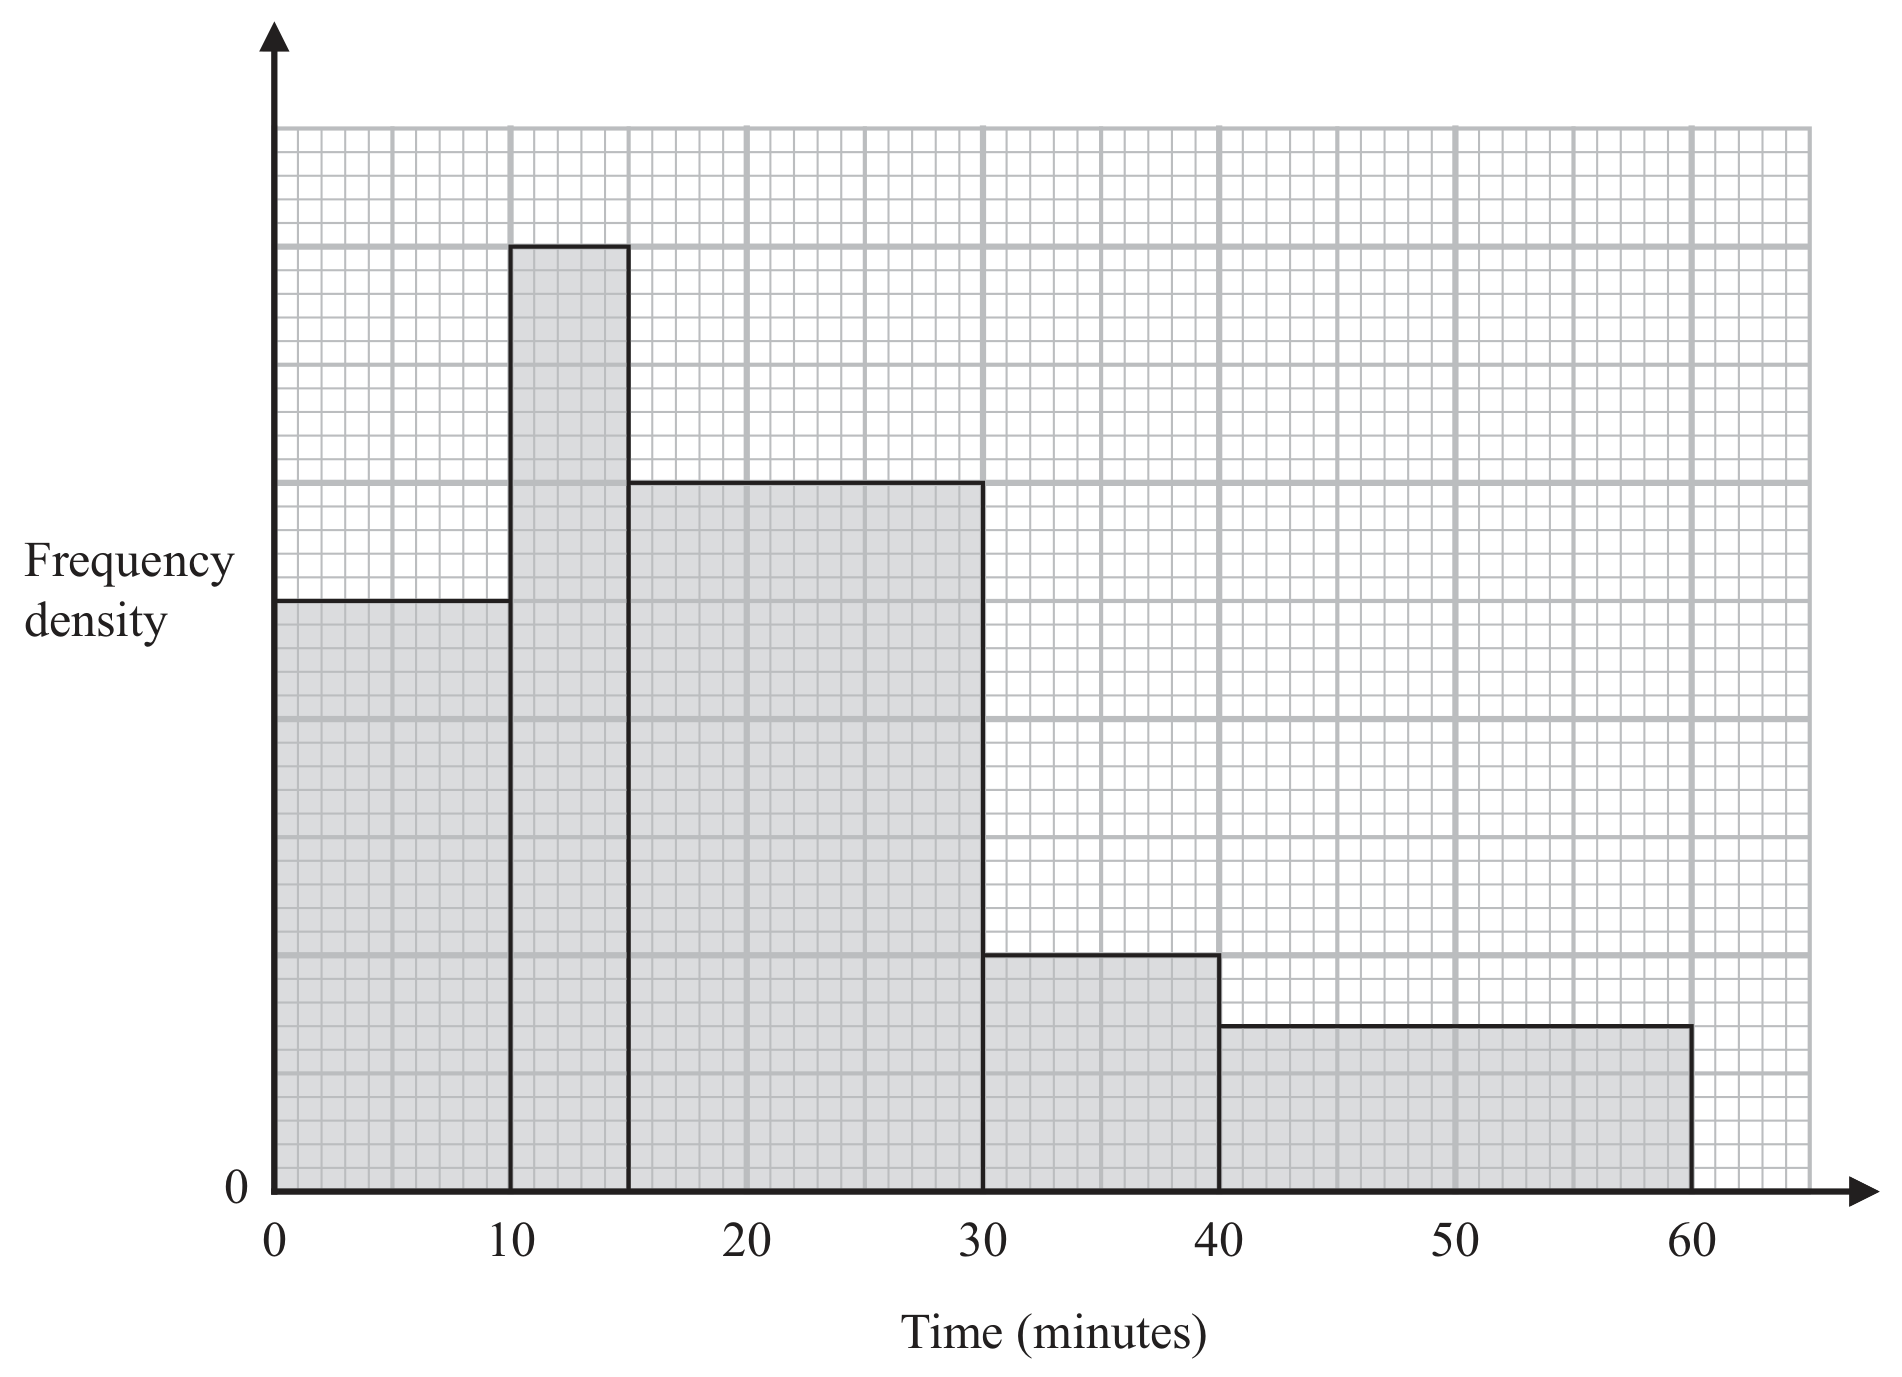
Figure for Question 21 — Edexcel IGCSE Math a Higher

20 of these trains arrived between 10 minutes late and 15 minutes late.
No trains arrived more than 60 minutes late.
Work out an estimate for the number of these trains that arrived at least 25 minutes late.