

Question 2
[Maximum number: 3]
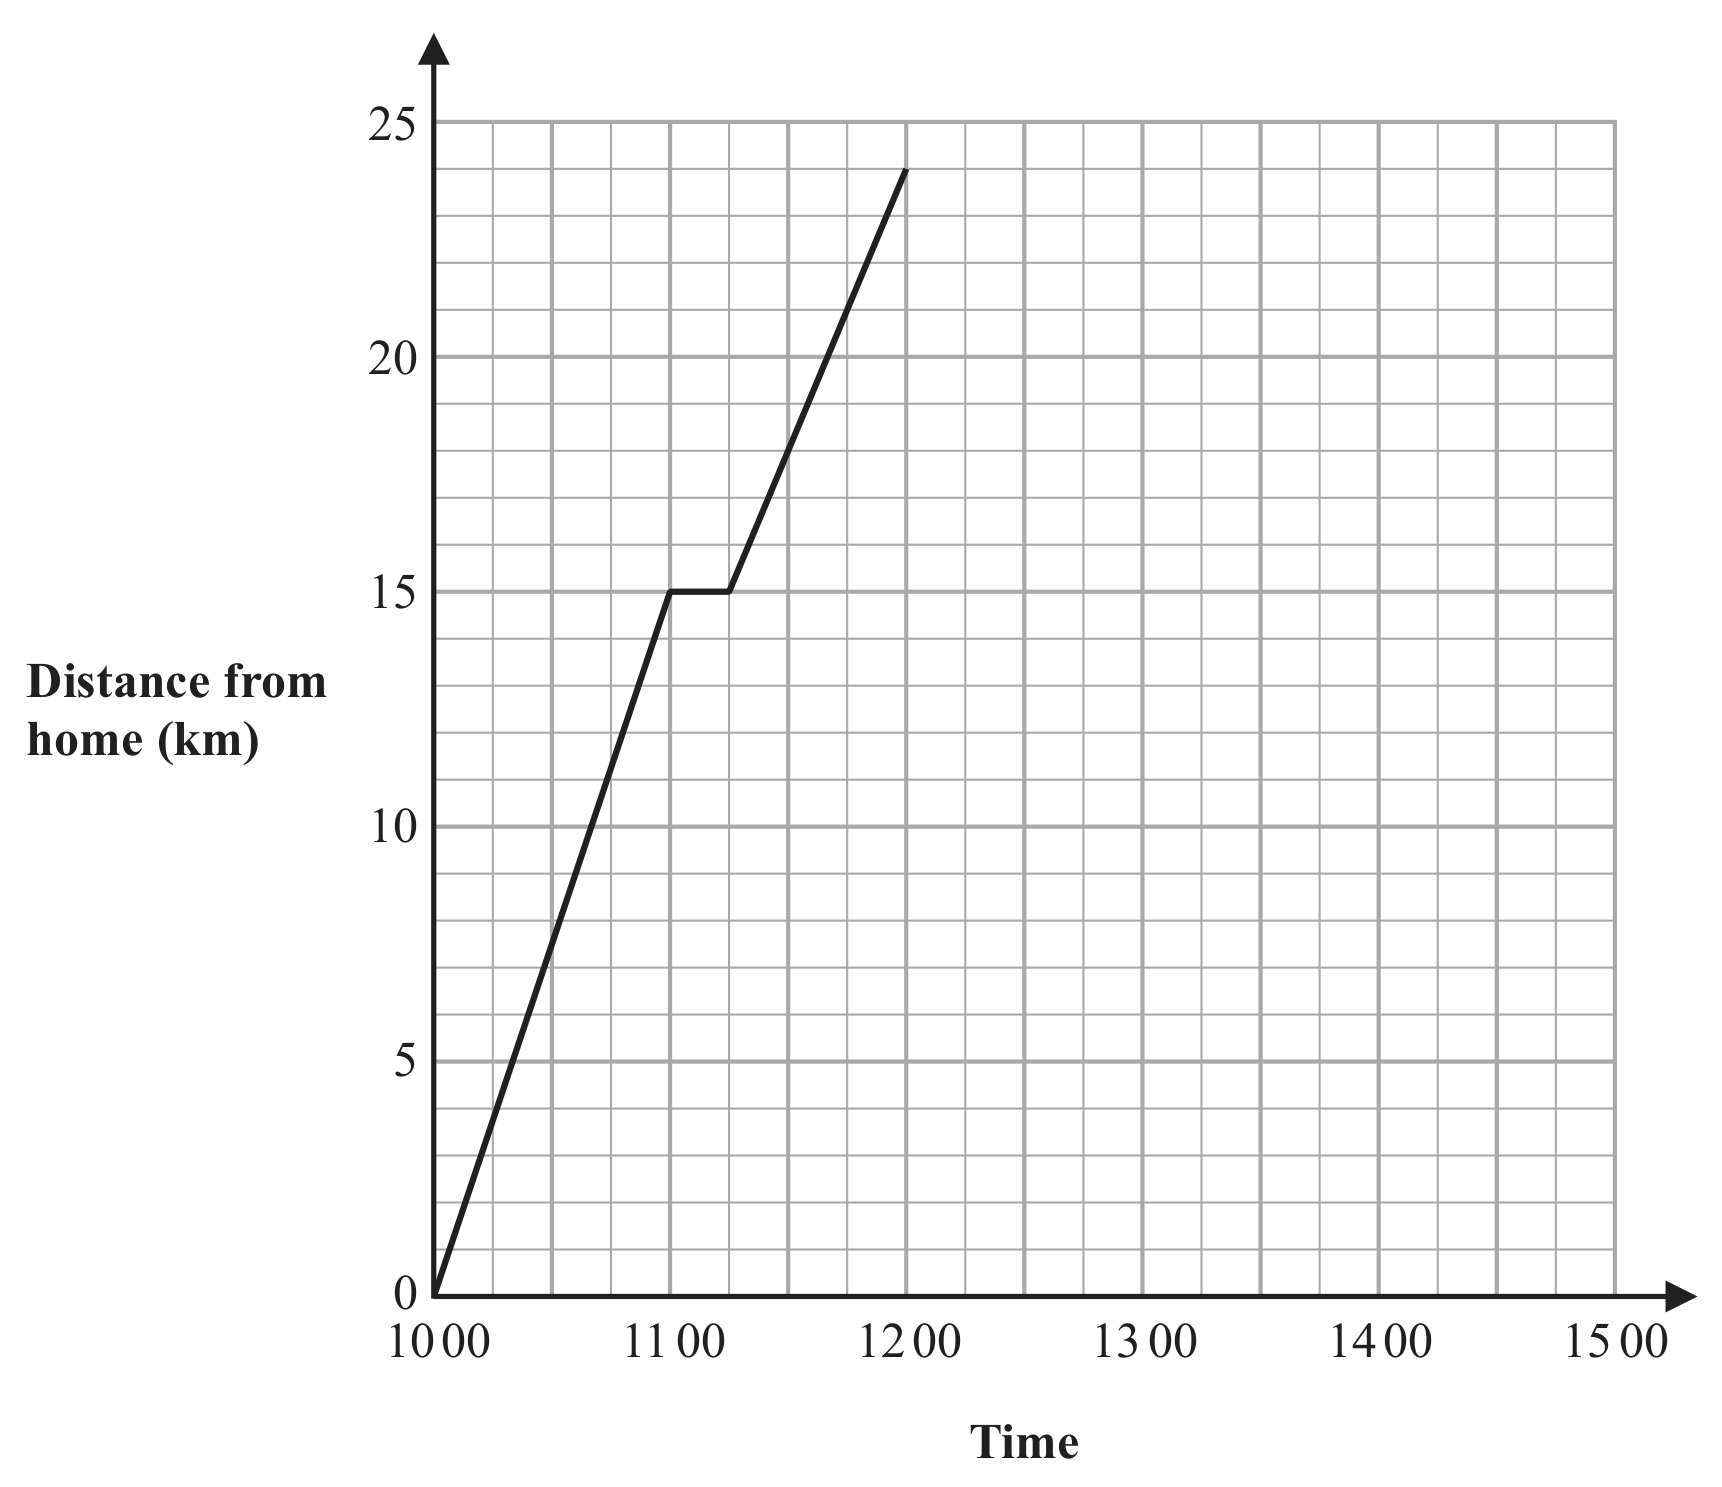
Jalina left her home at 1000 to cycle to a park.
On her way to the park, she stopped at a friend's house and then continued her journey to the park.
Here is the distance-time graph for her journey to the park.
Question 2(a)
(a)
On her journey to the park, did Jalina cycle at a faster speed before or after she stopped at her friend's house?
Give a reason for your answer.
Jalina stayed at the park for 45 minutes.
She then cycled, without stopping, at a constant speed of from the park back to her home.
[ 1 ]
Question 2(b)
(b)
Show all this information on the distance-time graph.
[ 2 ]