

Question 2(c)
[Maximum number: 2]
Figure 3 shows a long-run average cost (LRAC) curve diagram.
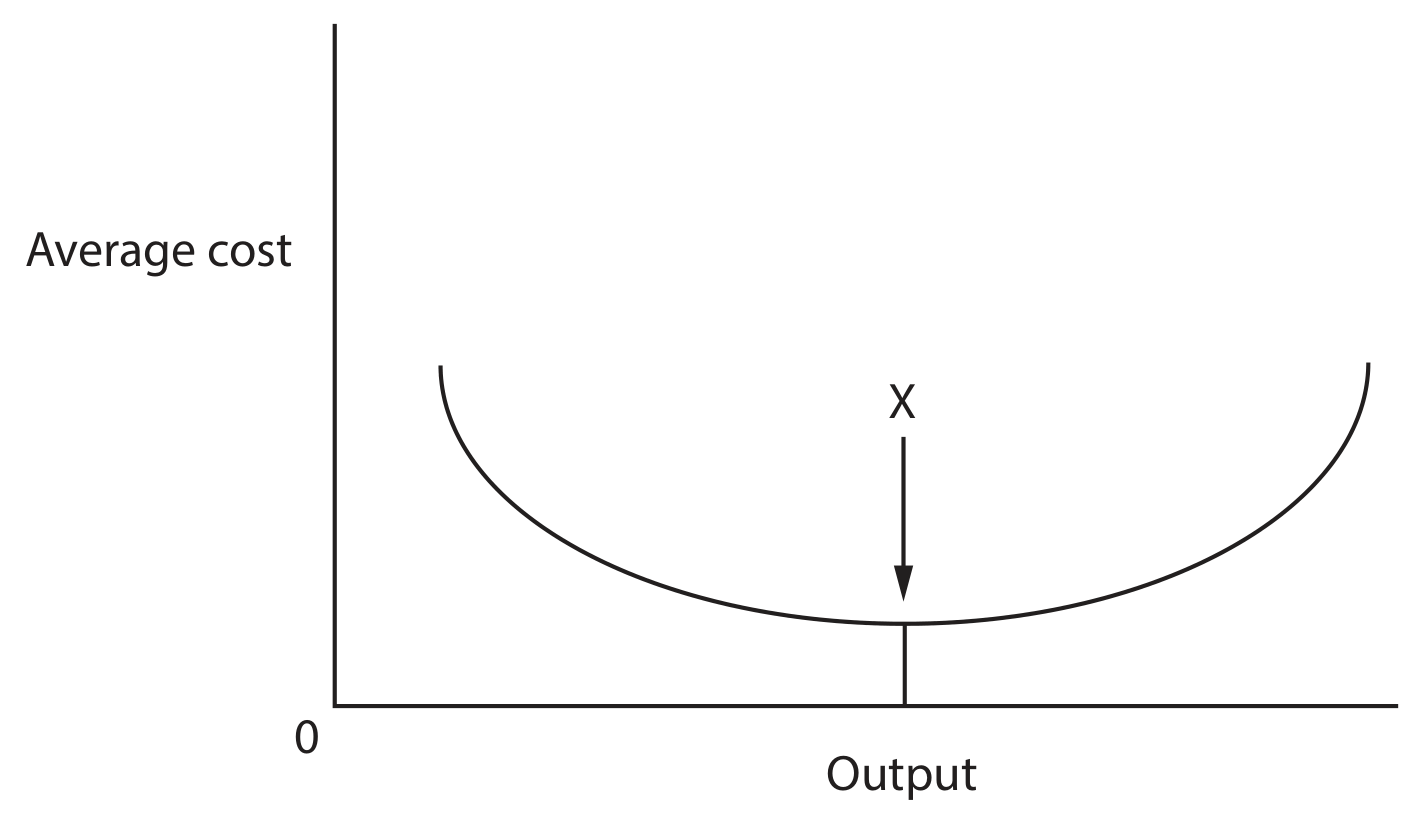
Figure 3
Figure 4 shows some of the financial information in August for a shop selling ice creams at a price of $ 3.50 each.
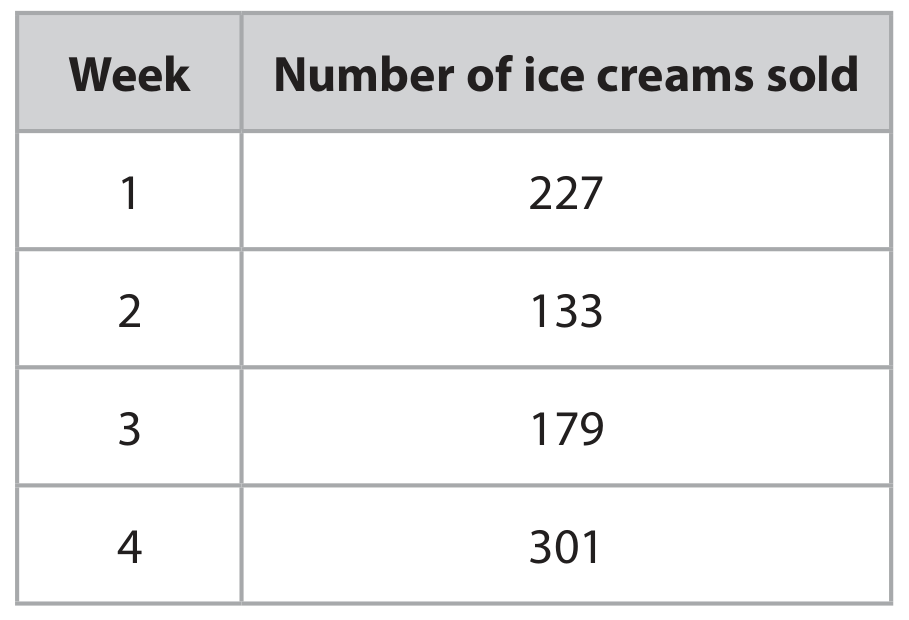
Figure 4
Calculate the total revenue for the shop in August. You are advised to show your working.