

EduNinja

Edexcel IGCSE Economics 1.1.3.b demand curve diagram

Edexcel IGCSE Economics 1.1.3.b demand curve diagram
Edexcel IGCSE Economics syllabusEconomics 4EC1First assessment 2019

Practise demand-curve questions by explaining price movements along the curve and identifying leftward or rightward demand shifts.

How this is tested

  • Use a demand curve to explain how a price fall changes quantity demanded.
  • Distinguish movement along demand from a rightward or leftward shift in the curve.

Question 1(b)

[Maximum number: 1]

Figure 1 below shows a change in demand for tickets to a sporting event.
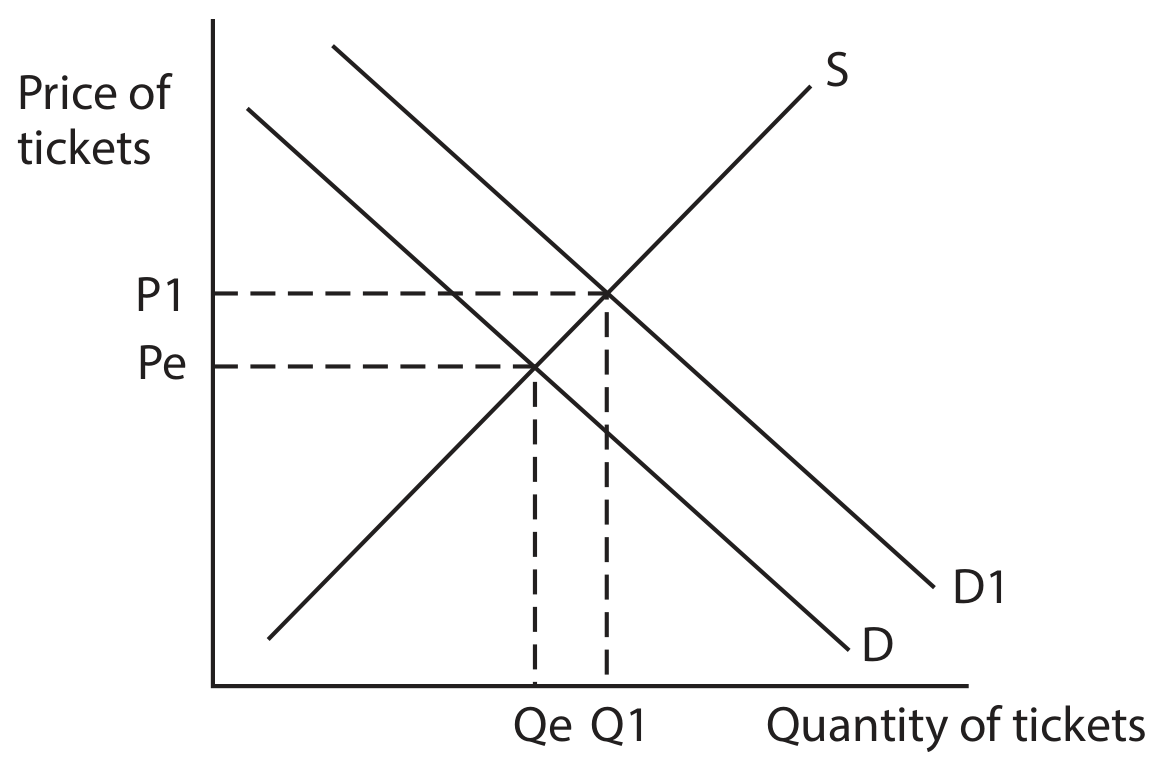
Figure 1

Figure 1

Which one of the following statements is true?

A

When the price falls, the quantity demanded falls

B

The demand curve slopes upwards from left to right

C

An increase in demand is shown by a shift to the right

D

A decrease in demand is shown by a shift to the right