EduNinja

IB ESS SL8.3 Urban air pollutionQuestion Bank

Question 1

[Maximum number: 1]

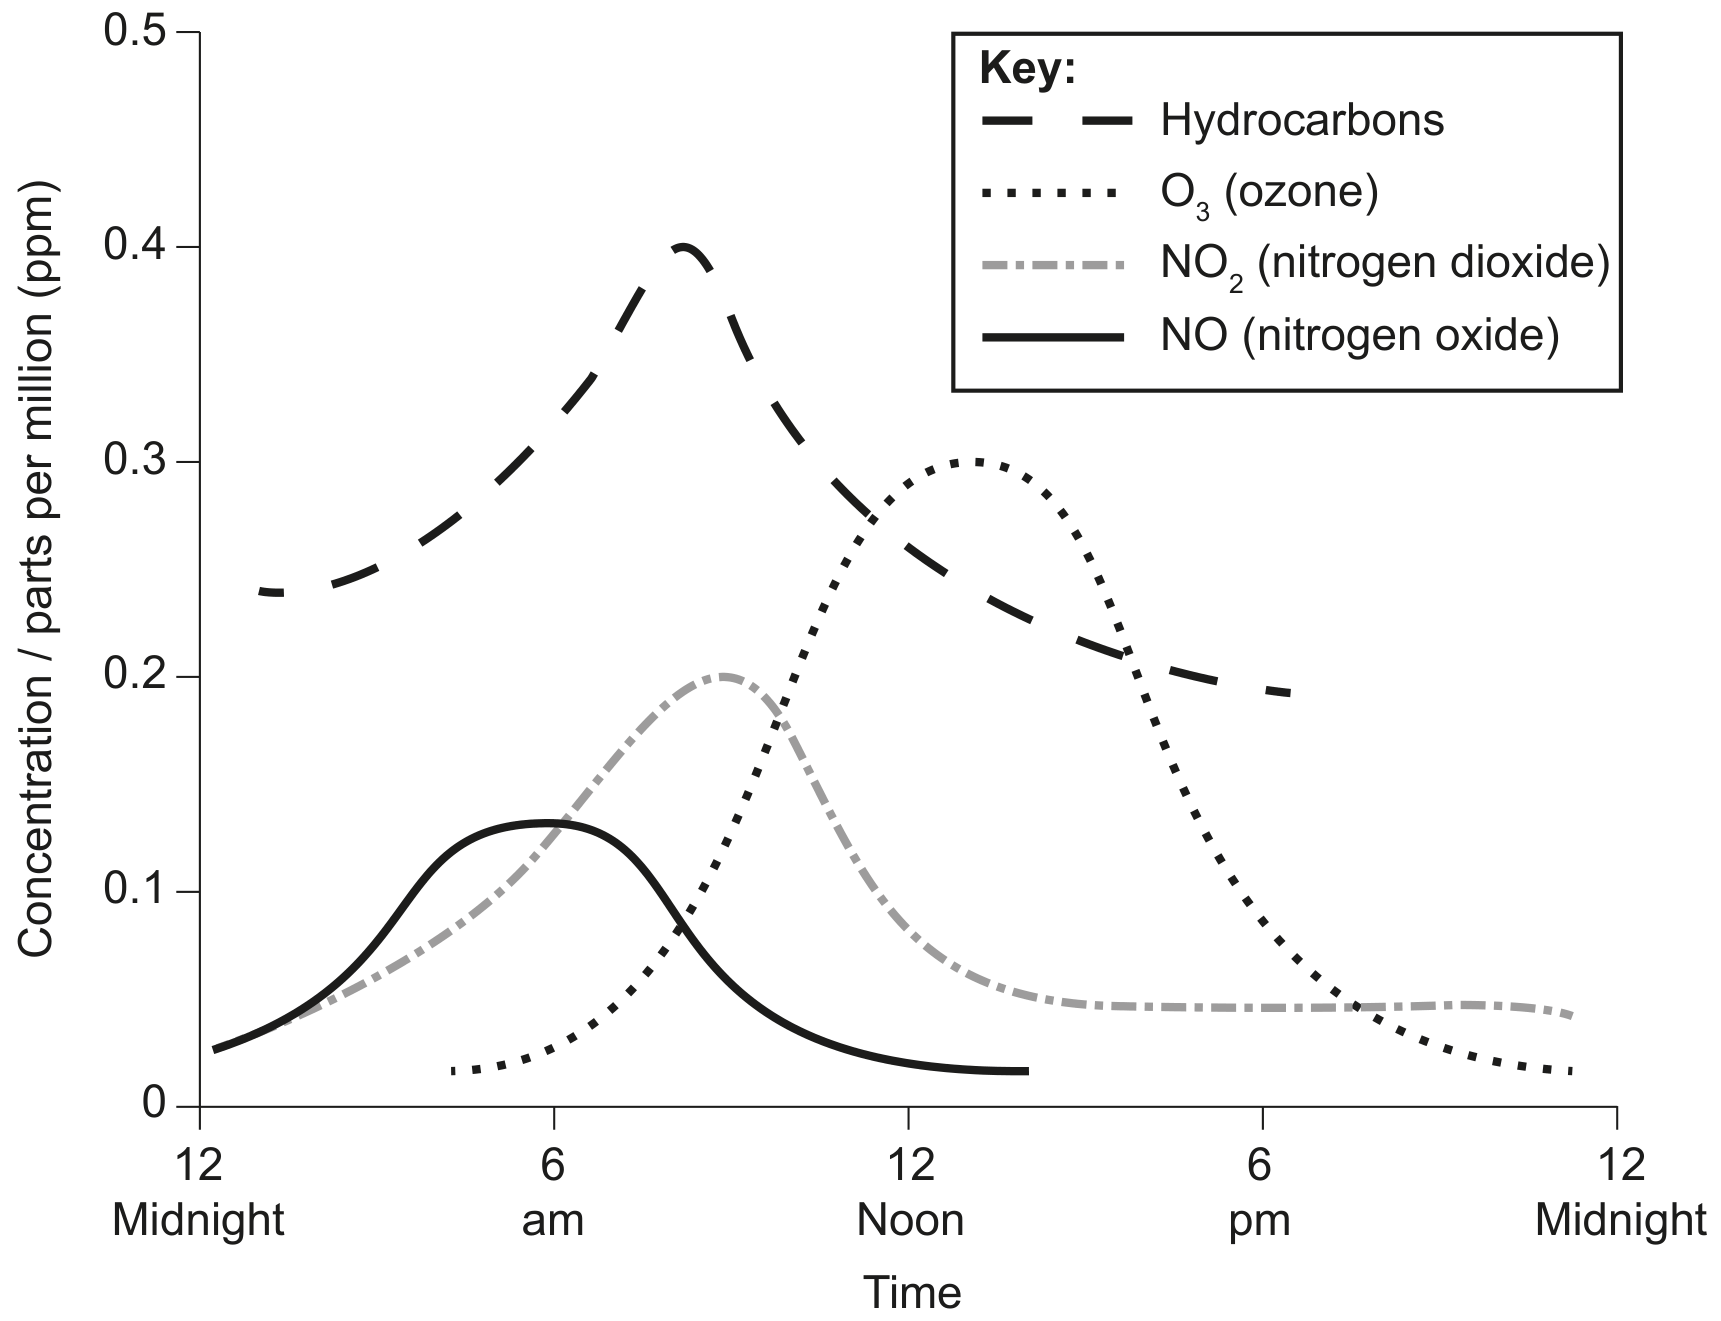
Figure 1: Changes in atmospheric ozone concentration in Los Angeles (California, USA) over a 24-hour period.
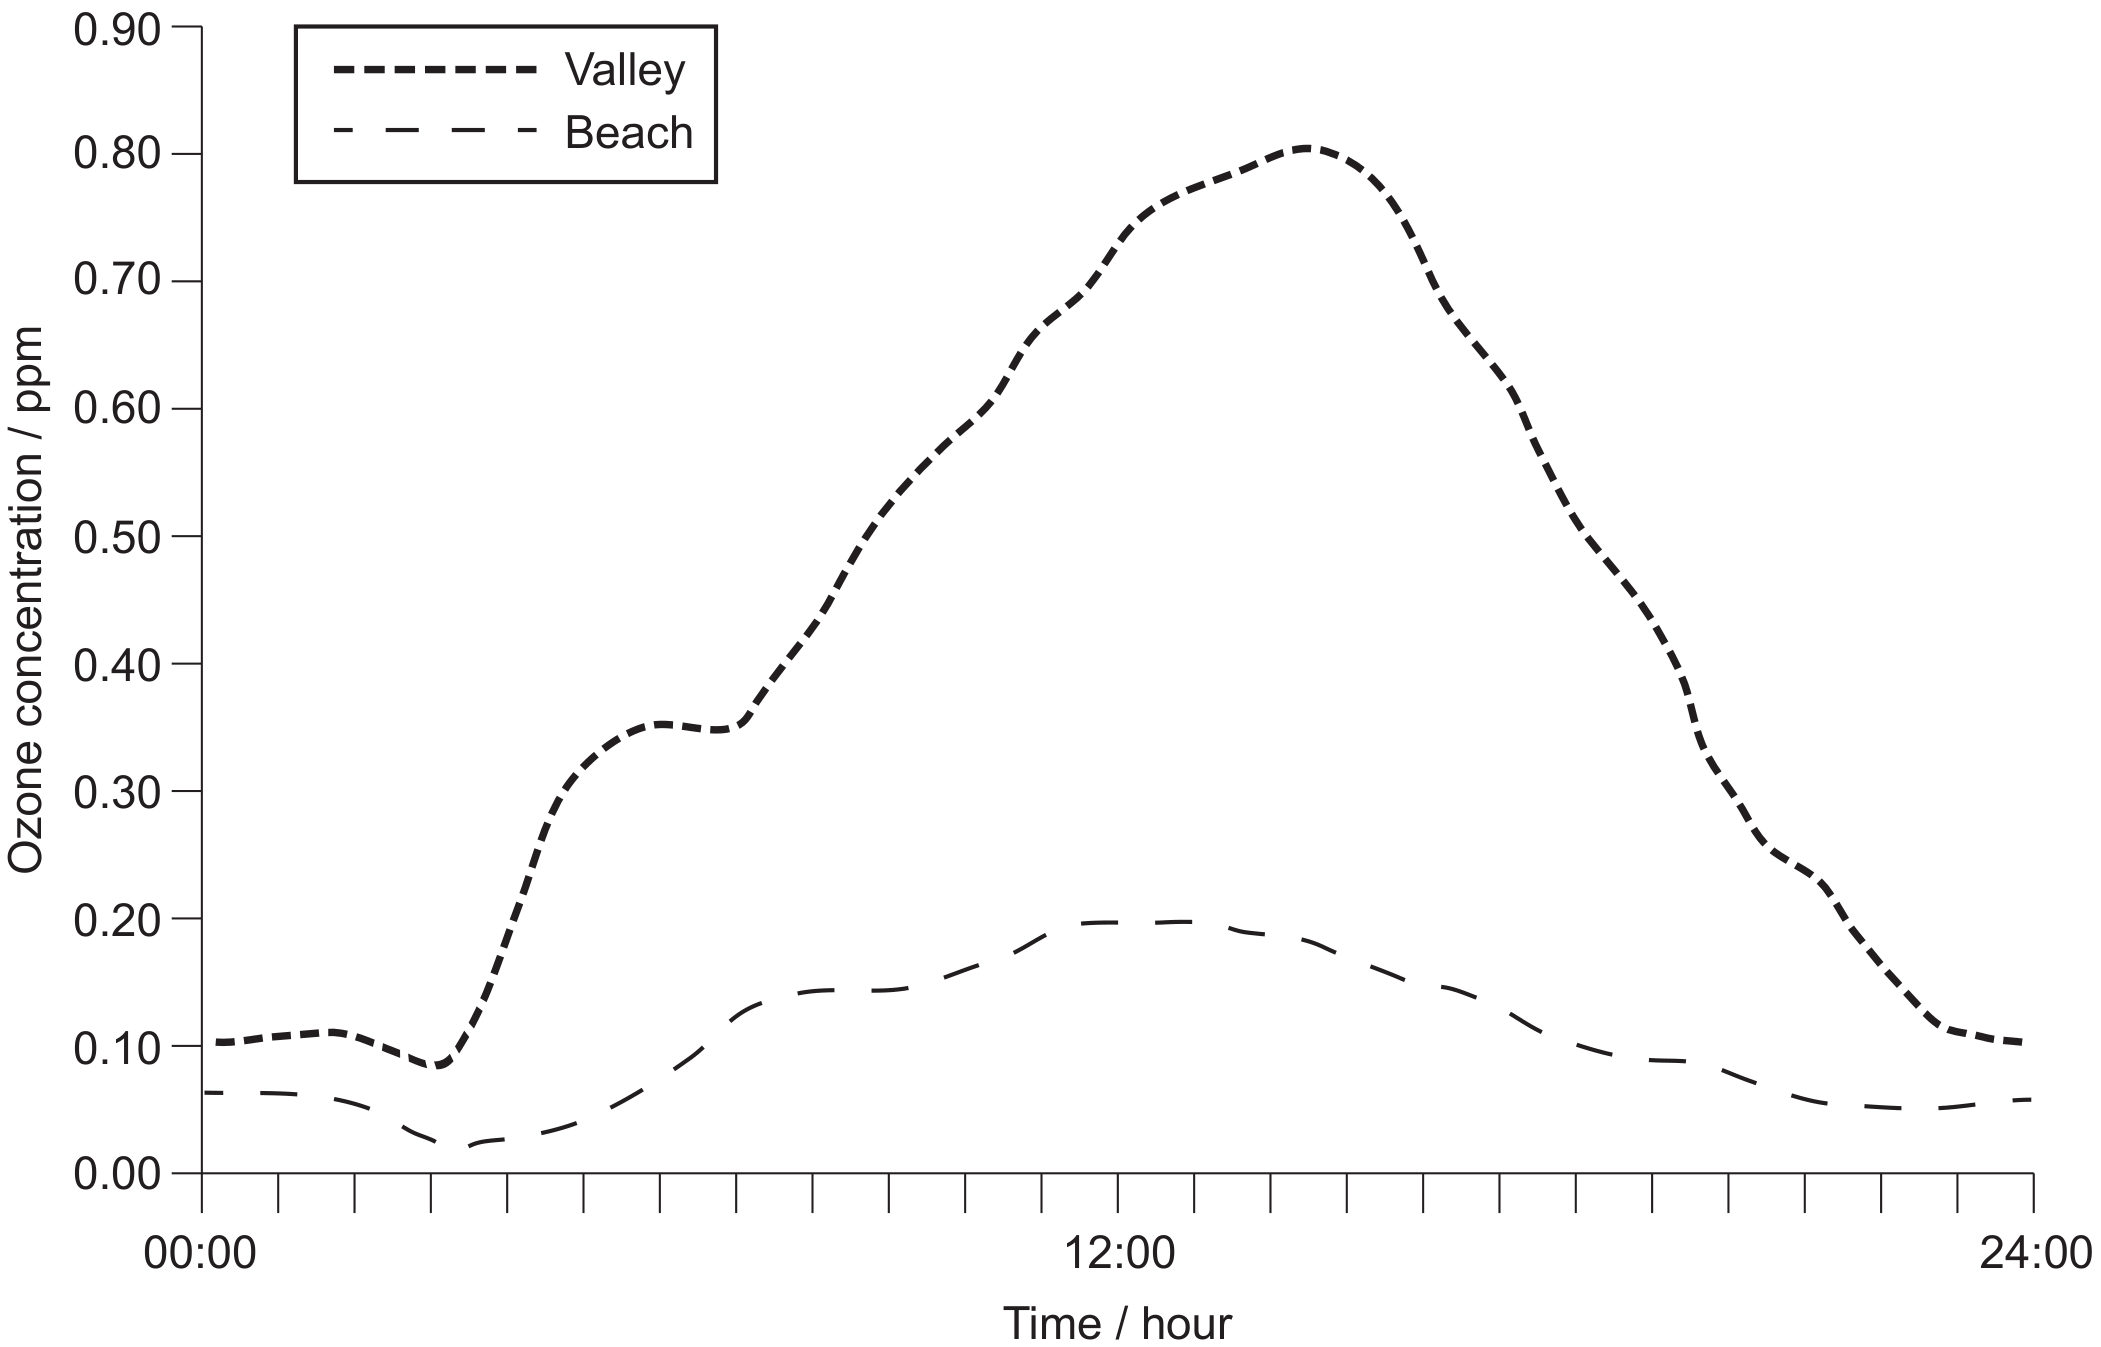
Figure 1

Figure 1

Question 1(a)

(a)

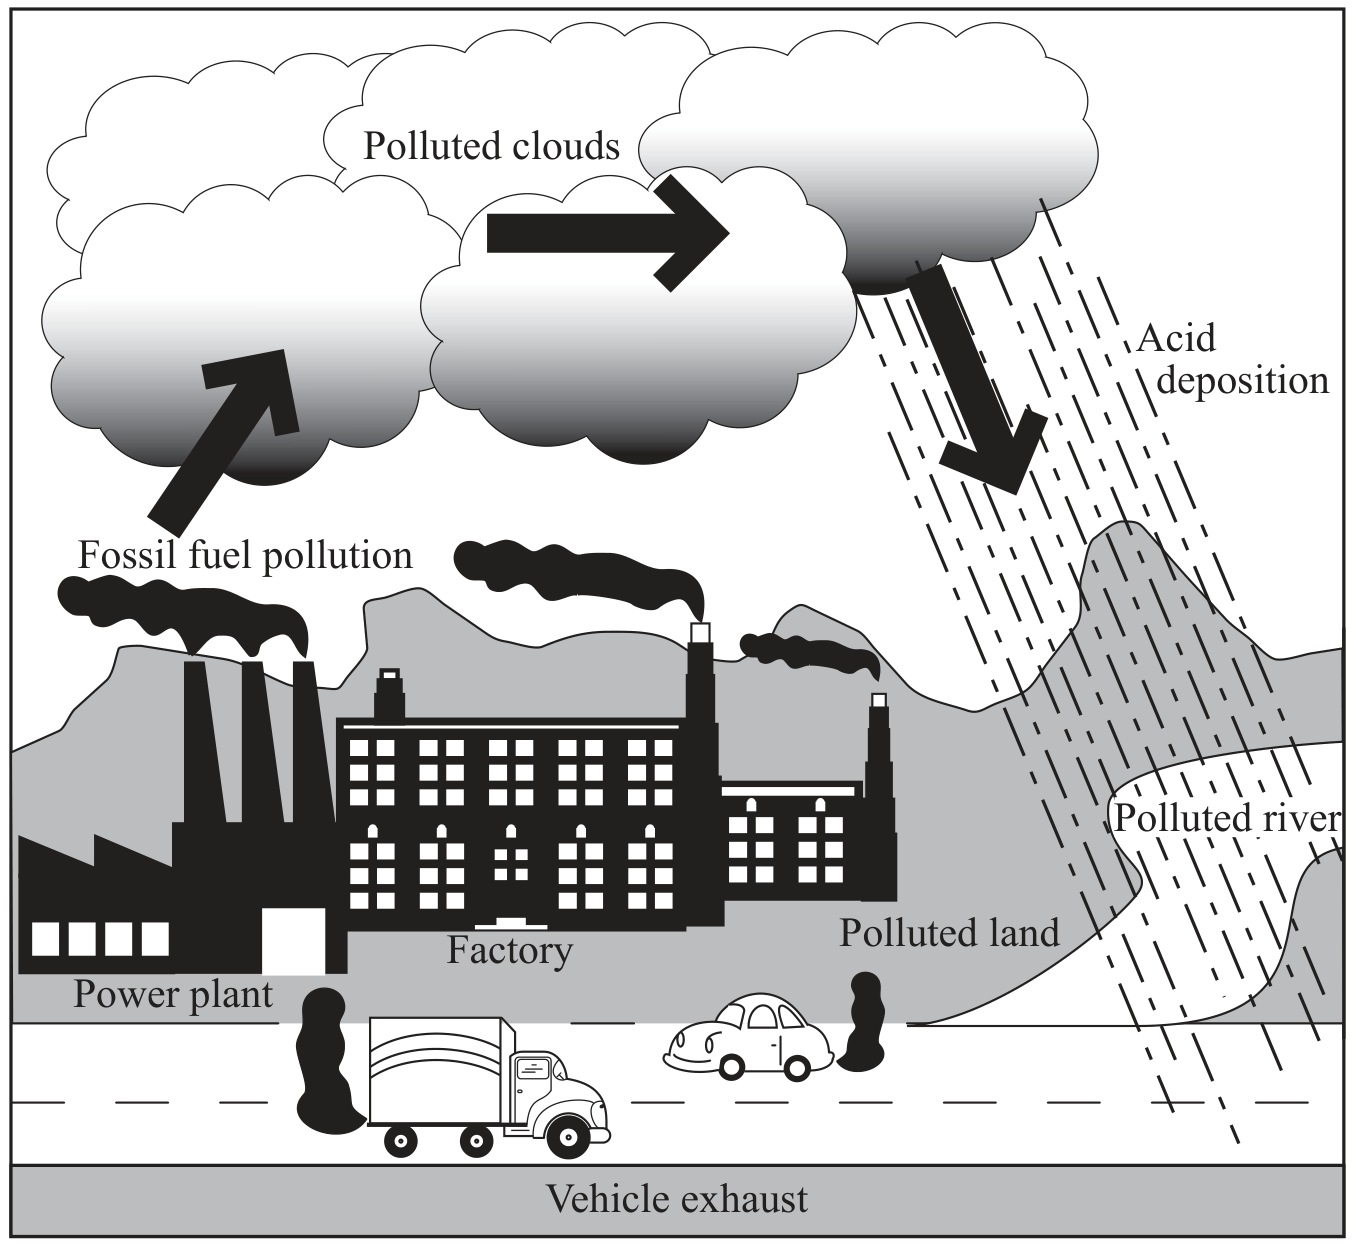
State the two primary air pollutants from fossil fuels which contribute to the formation of photochemical smog.

[ 1 ]

Question 4

Question 4(a)

(a)
Figure 6(b): Total annual sulphur dioxide and particulate emissions from smelting factories in Norilsk

Figure 6(b): Total annual sulphur dioxide and particulate emissions from smelting factories in Norilsk

With reference to Figure 6(b), identify one strategy that might have been used to achieve the trend in sulphur dioxide emissions since the early 1980s.

[ 1 ]

Question 4(b)

(b)
Figure 6(c): Vegetation damage associated with smelting factories in Norilsk

Figure 6(c): Vegetation damage associated with smelting factories in Norilsk

Explain the distribution of vegetation damage shown in Figure 6(c).

[ 3 ]

Question 2

[Maximum number: 5]

Figure 2 below shows some of the sources and processes that lead to acid deposition.

Figure 2

Figure 2

Question 2(a)

Question 2(a)(i)

(a)
(i)

Burning fossil fuels produces gases often called SOx\mathrm{SO}_{\mathrm{x}} and NOx\mathrm{NO}_{\mathrm{x}}. State the names of the two acids usually produced when SOx\mathrm{SO}_{\mathrm{x}} and NOx\mathrm{NO}_{\mathrm{x}} dissolve in water.

[ 1 ]

Question 2(b)

Question 2(b)(i)

(b)
(i)

Compare and contrast the trends in transport emissions for SOx\mathrm{SO}_{\mathrm{x}} and NOx\mathrm{NO}_{\mathrm{x}}, shown in Figure 3.

[ 2 ]

Question 2(b)(ii)

(ii)

Outline how both an advance in technology and a change in human activity have reduced transport emissions of SOx\mathrm{SO}_{\mathrm{x}} and NOx\mathrm{NO}_{\mathrm{x}}.

Advance in technology:

Changes in human activity:

[ 2 ]

Question 3

[Maximum number: 1]
Figure 4: Climate of Beijing

Figure 4: Climate of Beijing

Question 3(a)

(a)
Figure 6(c): Average monthly PM2.5 levels in Beijing

Figure 6(c): Average monthly PM2.5 levels in Beijing

Figure 6(b): Fact file on particulate matter
Figure 6(b): PM2.5 and PM10 are small particles such as dust, soot and smoke suspended in air.
If inhaled, they can enter the lungs and cause coughing, asthma attacks, bronchitis, heart attacks and cancer.
WHO estimates nearly one million people in China die annually from exposure to PM2.5 and PM10.

Outline one reason why PM2.5\mathrm{PM}_{2.5} levels are highest during December as shown in Figure 6(c).

[ 1 ]

Question 4

[Maximum number: 3]

Figure 6(a): In 2018, the Beijing Clean Air Action Plan included limiting car ownership with quotas of 100000 new car purchases per year.
Coal consumption was reduced from 30 million tonnes in 2005 to 4 million tonnes.
The plan created forested areas and green spaces including 5 urban forests, 21 green spaces, 10 leisure parks and 100 km of greenways.
Beijing has the potential to reach net zero carbon emissions by 2050.

Figure 6(e): Annual average concentrations of air pollutants in Beijing, 1998-2017

Figure 6(e): Annual average concentrations of air pollutants in Beijing, 1998-2017

Figure 7: Transport in Beijing, 1999-2017

Figure 7: Transport in Beijing, 1999-2017

With reference to the information in the resource booklet, explain how the problem of acid deposition is likely to have changed since 2004.

Question 4

[Maximum number: 8]
Figure 4(a): Green spaces in London

Figure 4(a): Green spaces in London

Question 4(a)

(a)
Figure 9: Annual mean oxides of nitrogen ( \(\mathrm{NO

Figure 9: Annual mean oxides of nitrogen ( \(\mathrm{NO

With reference to Figure 9, explain why the highest levels of NOx\mathrm{NO}_{\mathrm{x}} are found in the centre of London.

[ 3 ]

Question 4(b)

(b)

Evaluate one strategy to reduce NOx\mathrm{NO}_{\mathrm{x}} emissions from transport.

[ 3 ]

Question 4(c)

(c)

Identify two potential impacts of improved air quality on London and its population.

[ 2 ]

Question 5

Question 5(b)

Question 5(b)(ii)

(a)
(i)

Evaluate one management strategy for urban air pollution.

[ 3 ]

Question 3

[Maximum number: 4]
Figure 3: Concentration of atmospheric pollutants associated with photochemical smog

Figure 3: Concentration of atmospheric pollutants associated with photochemical smog

Vesilind, Chapter 18 - Air Pollution, Page 253, Copyright 1998, with permission from Elsevier (http://www.elsevier.com).]

Question 3(a)

Question 3(a)(i)

(a)
(i)

Identify one primary pollutant from the pollutants shown in Figure 3.

[ 1 ]

Question 3(a)(ii)

(ii)

Outline why the pollutant named in Question 3 (a)(i) is referred to as a primary pollutant.

[ 1 ]

Question 3(b)

(b)

Outline one reason why there is an increase in nitrogen oxides and hydrocarbons early in the day.

[ 1 ]

Question 3(f)

(c)

Outline the role of catalytic converters in reducing photochemical smog.

[ 1 ]

Question 5

[Maximum number: 5]

China has large reserves of coal and has used this to enable rapid economic development. This has led to environmental problems including acid deposition.

Figure 5: The average pH value of precipitation (acid deposition) for China in 2009.

Figure 5: The average pH value of precipitation (acid deposition) for China in 2009.

Question 5(a)

(a)

State one gas which contributes to acid deposition.

[ 1 ]

Question 5(b)

(b)

Identify two possible reasons for the pattern of acid deposition in China.

[ 2 ]

Question 5(c)

(c)

Outline two possible environmental effects of acid deposition on the areas with a pH of 5.0 or below.

[ 2 ]

Question 4

Question 4(b)

(a)

Figure 4 below shows the distribution of two forms of peppered moths in woodlands of the UK in the 1950s. At the time, surfaces of most trees in Central and South Eastern England were heavily blackened with deposits of carbon from local coal burning. There are two forms of the moth, dark and light, and both may be eaten by woodland birds.

Figure 4

Figure 4

[ 4 ]

Question 4(b)(i)

(i)

Describe the relationship between the distribution of the two forms of moths and habitat pollution.

[ 1 ]

Question 4(b)(ii)

(ii)

Suggest one reason to explain the relationship you have identified in (b)(i).

[ 1 ]

Question 4(b)(iii)

(iii)

Outline two ways in which urban air pollution can be reduced.

[ 2 ]

Question 4(c)

(b)

Explain one way in which atmospheric conditions can contribute to air pollution.

[ 2 ]
0 selected