Question 1
Question 1(b)
Question 1(b)(ii)
(a)
(i)
With reference to Figure 1 calculate the NIR for Japan (Y).
[ 1 ]
 EduNinja
With reference to Figure 1 calculate the NIR for Japan (Y).
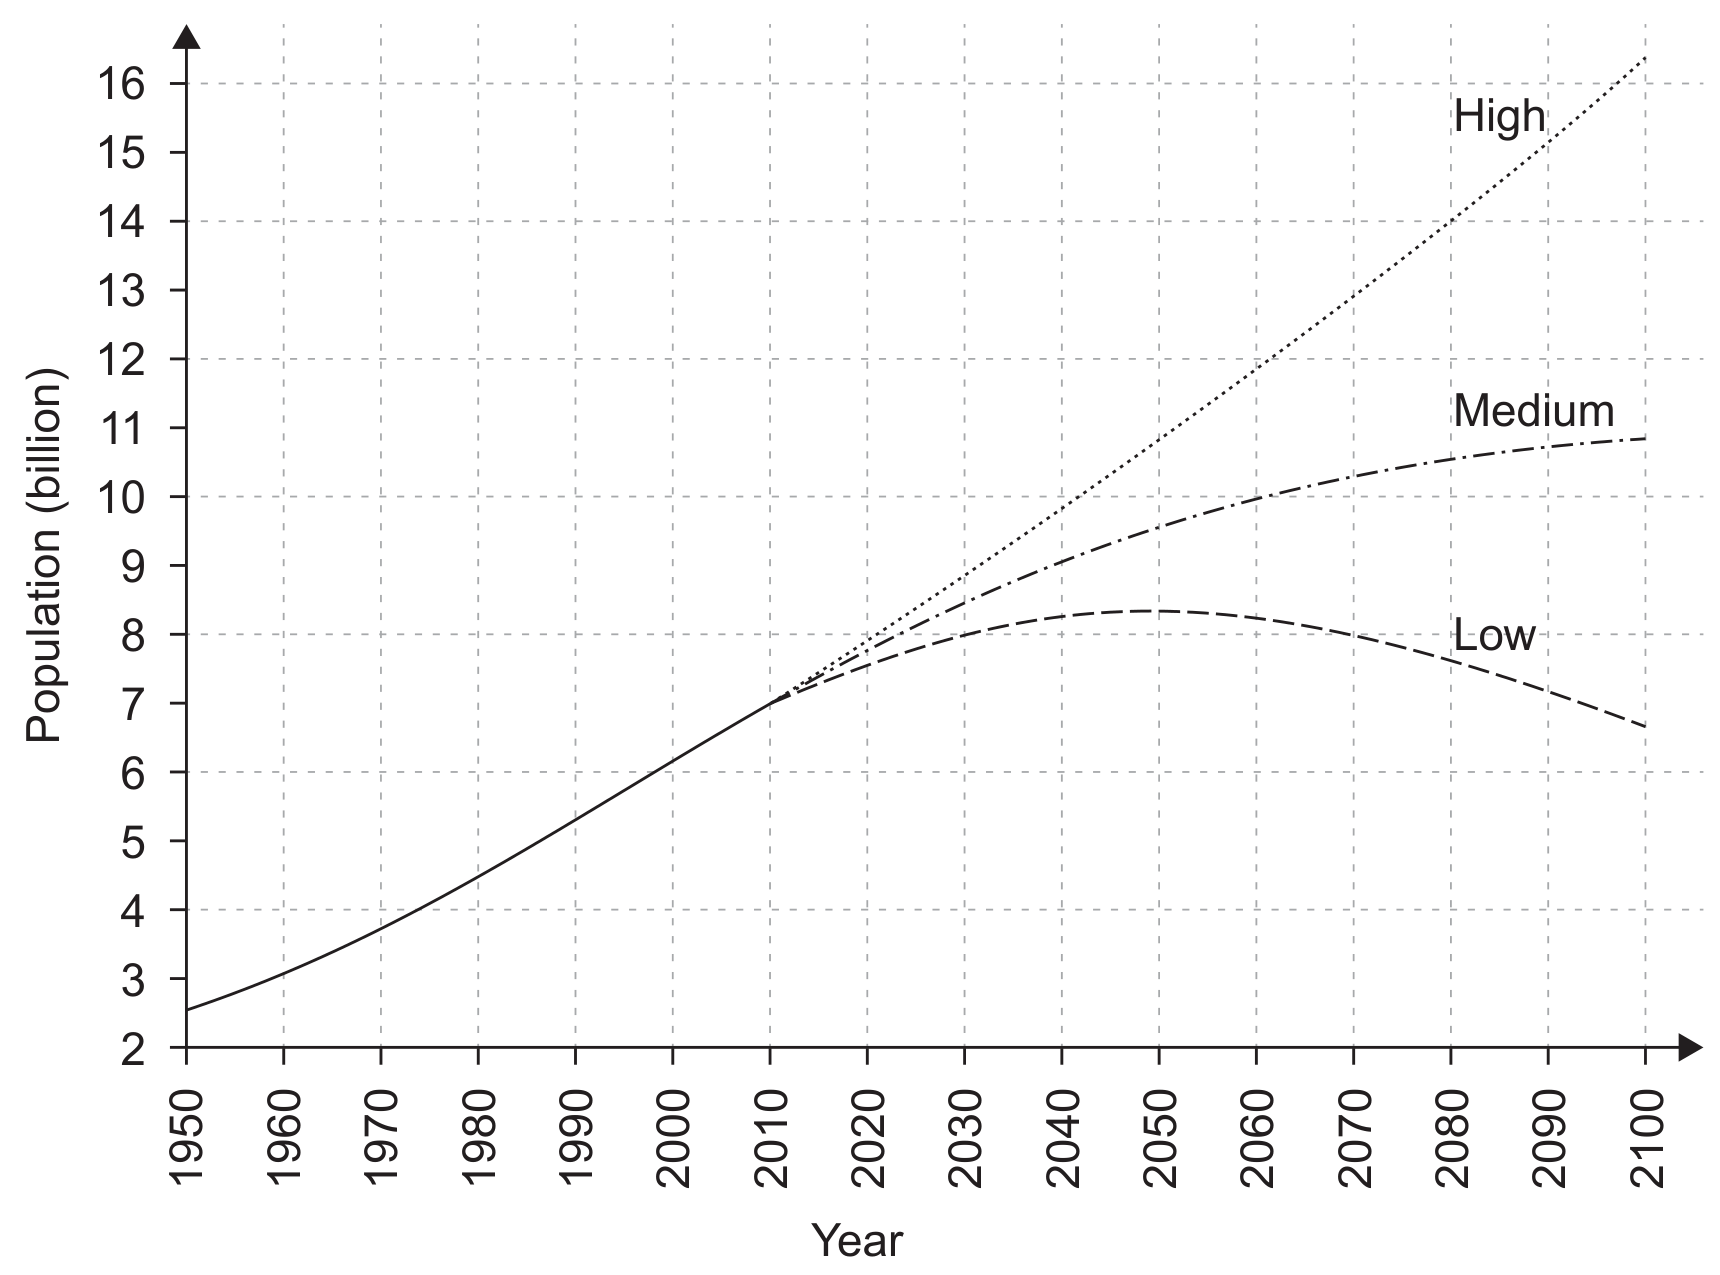
Three projections for world population from the present day to 2100.
The three lines indicate the high, medium and low projections for population size.
Calculate the range between the highest and lowest projected population size for 2100.
Outline one economic implication of the highest projection for world population being realised.
Outline one environmental implication of the highest projection for world population being realised.
Using the data in Figure 6, draw a line graph to show the increase in the population of the Naivasha area between the years 1969 and 2009.
Graph grid for population growth in the Naivasha area, 1969-2009
| Year | Approximate number of people |
|---|---|
| 1969 | 45000 |
| 1979 | 95000 |
| 1989 | 105000 |
| 1999 | 160000 |
| 2005 | 250000 |
| 2009 | 300000 |
Figure 6: Population growth in the Naivasha area
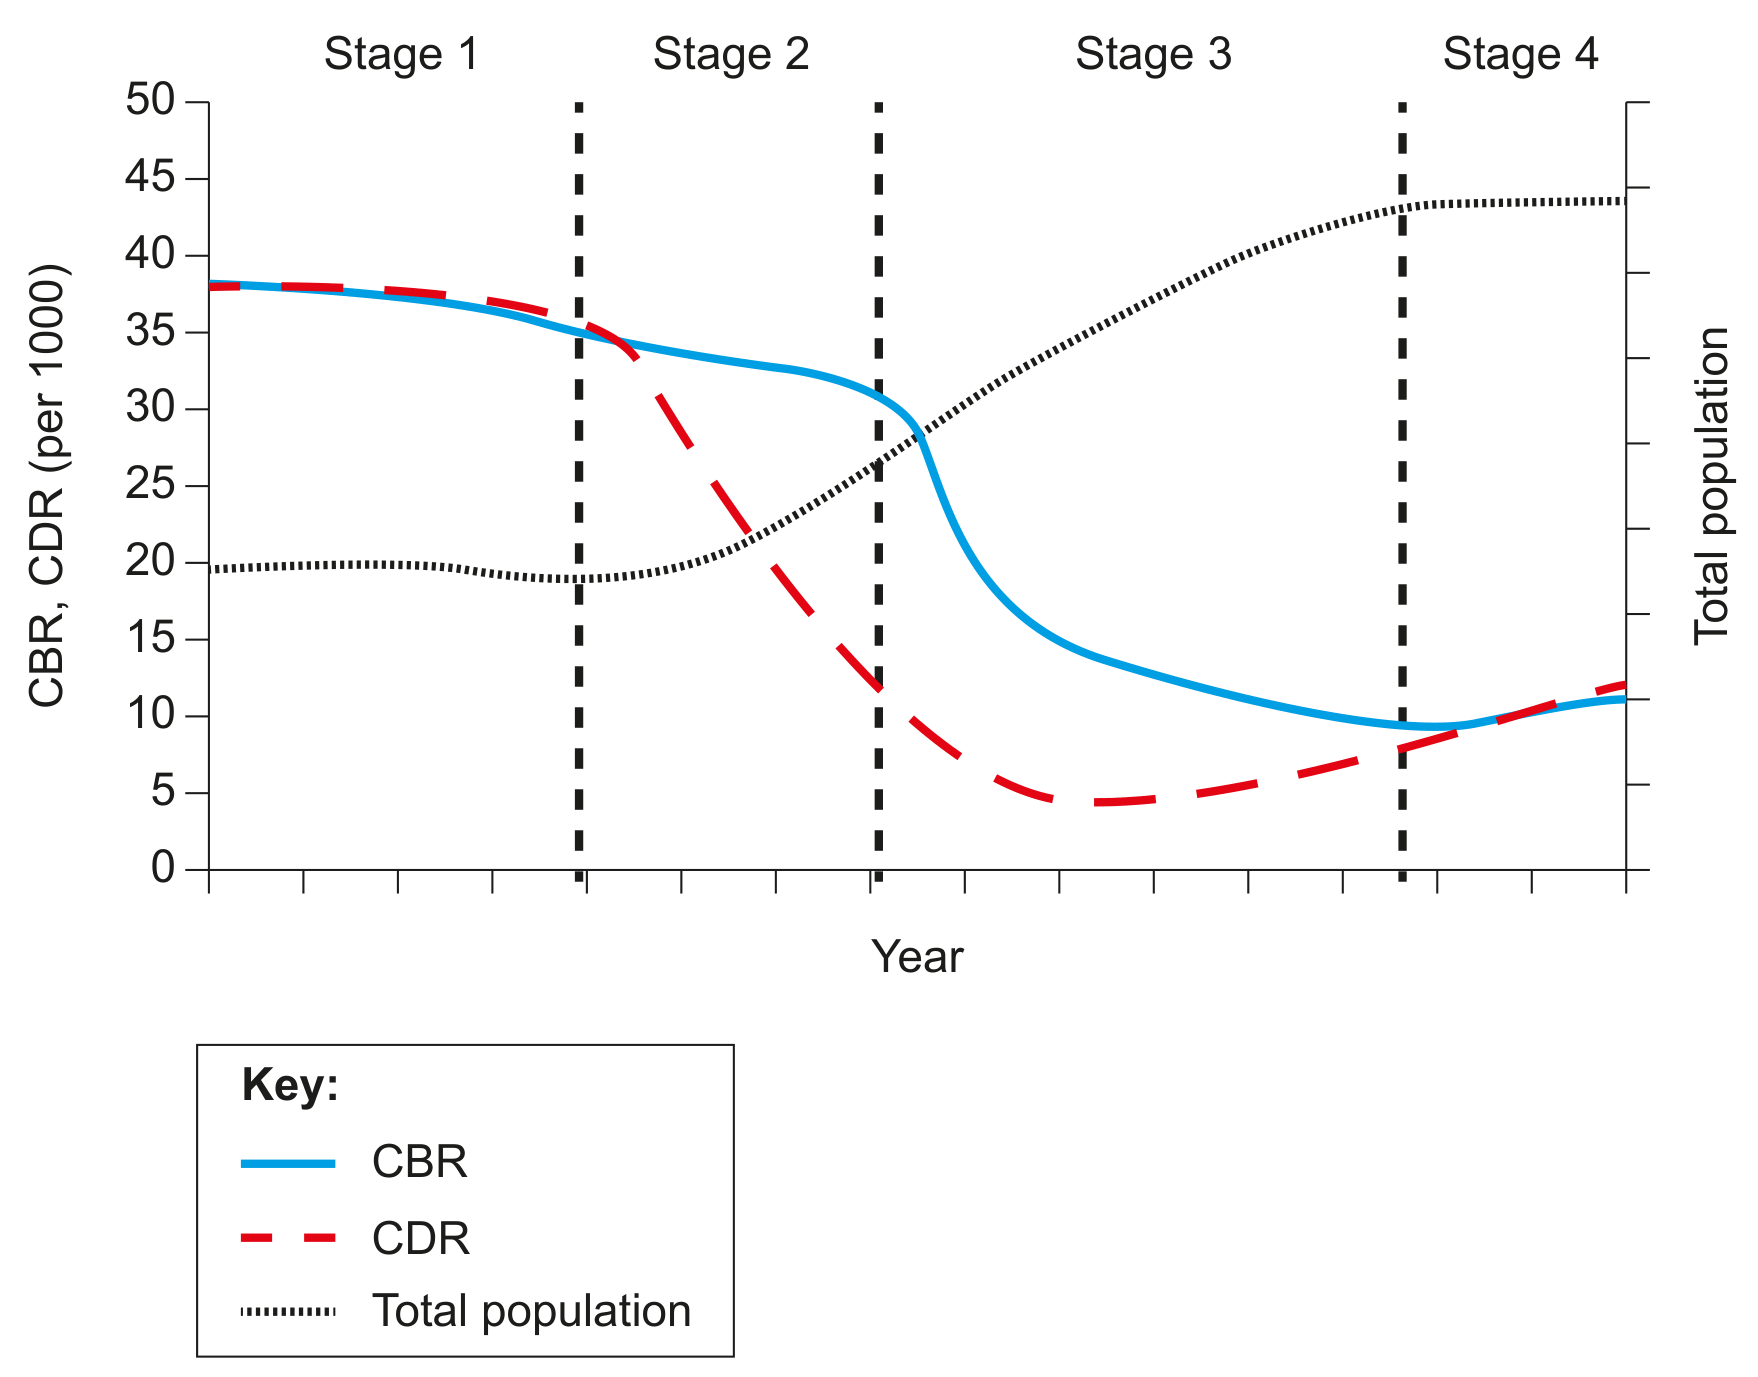
Figure 1: Demographic transition model
Costa Rica has a crude birth rate (CBR) of 15.3 and a crude death rate (CDR) of 4.8.
Identify the stage in which Costa Rica would be placed on the demographic transition model shown in Figure 1.
Calculate the natural increase rate (NIR) for Costa Rica.
Calculate the doubling time for Costa Rica.
Outline one strength and one limitation of the demographic transition model.
Outline the socioeconomic factors that may cause a society to move from Stage 2 to Stage 3 on the demographic transition model.
Figure 3(a): Fact file on Beijing population
Figure 3(a): In 2019 Beijing had about 20.04 million people.
In 2018, life expectancy in Beijing was 81.2 years compared with 76.4 years for China.
In 2017, policies were implemented to restrict future Beijing population to 23 million by discouraging migration, encouraging relocation and relocating factories outside Beijing.
Identify one reason why in 2018 the life expectancy in Beijing was higher than the national average for China, as referred to in Figure 3(a).
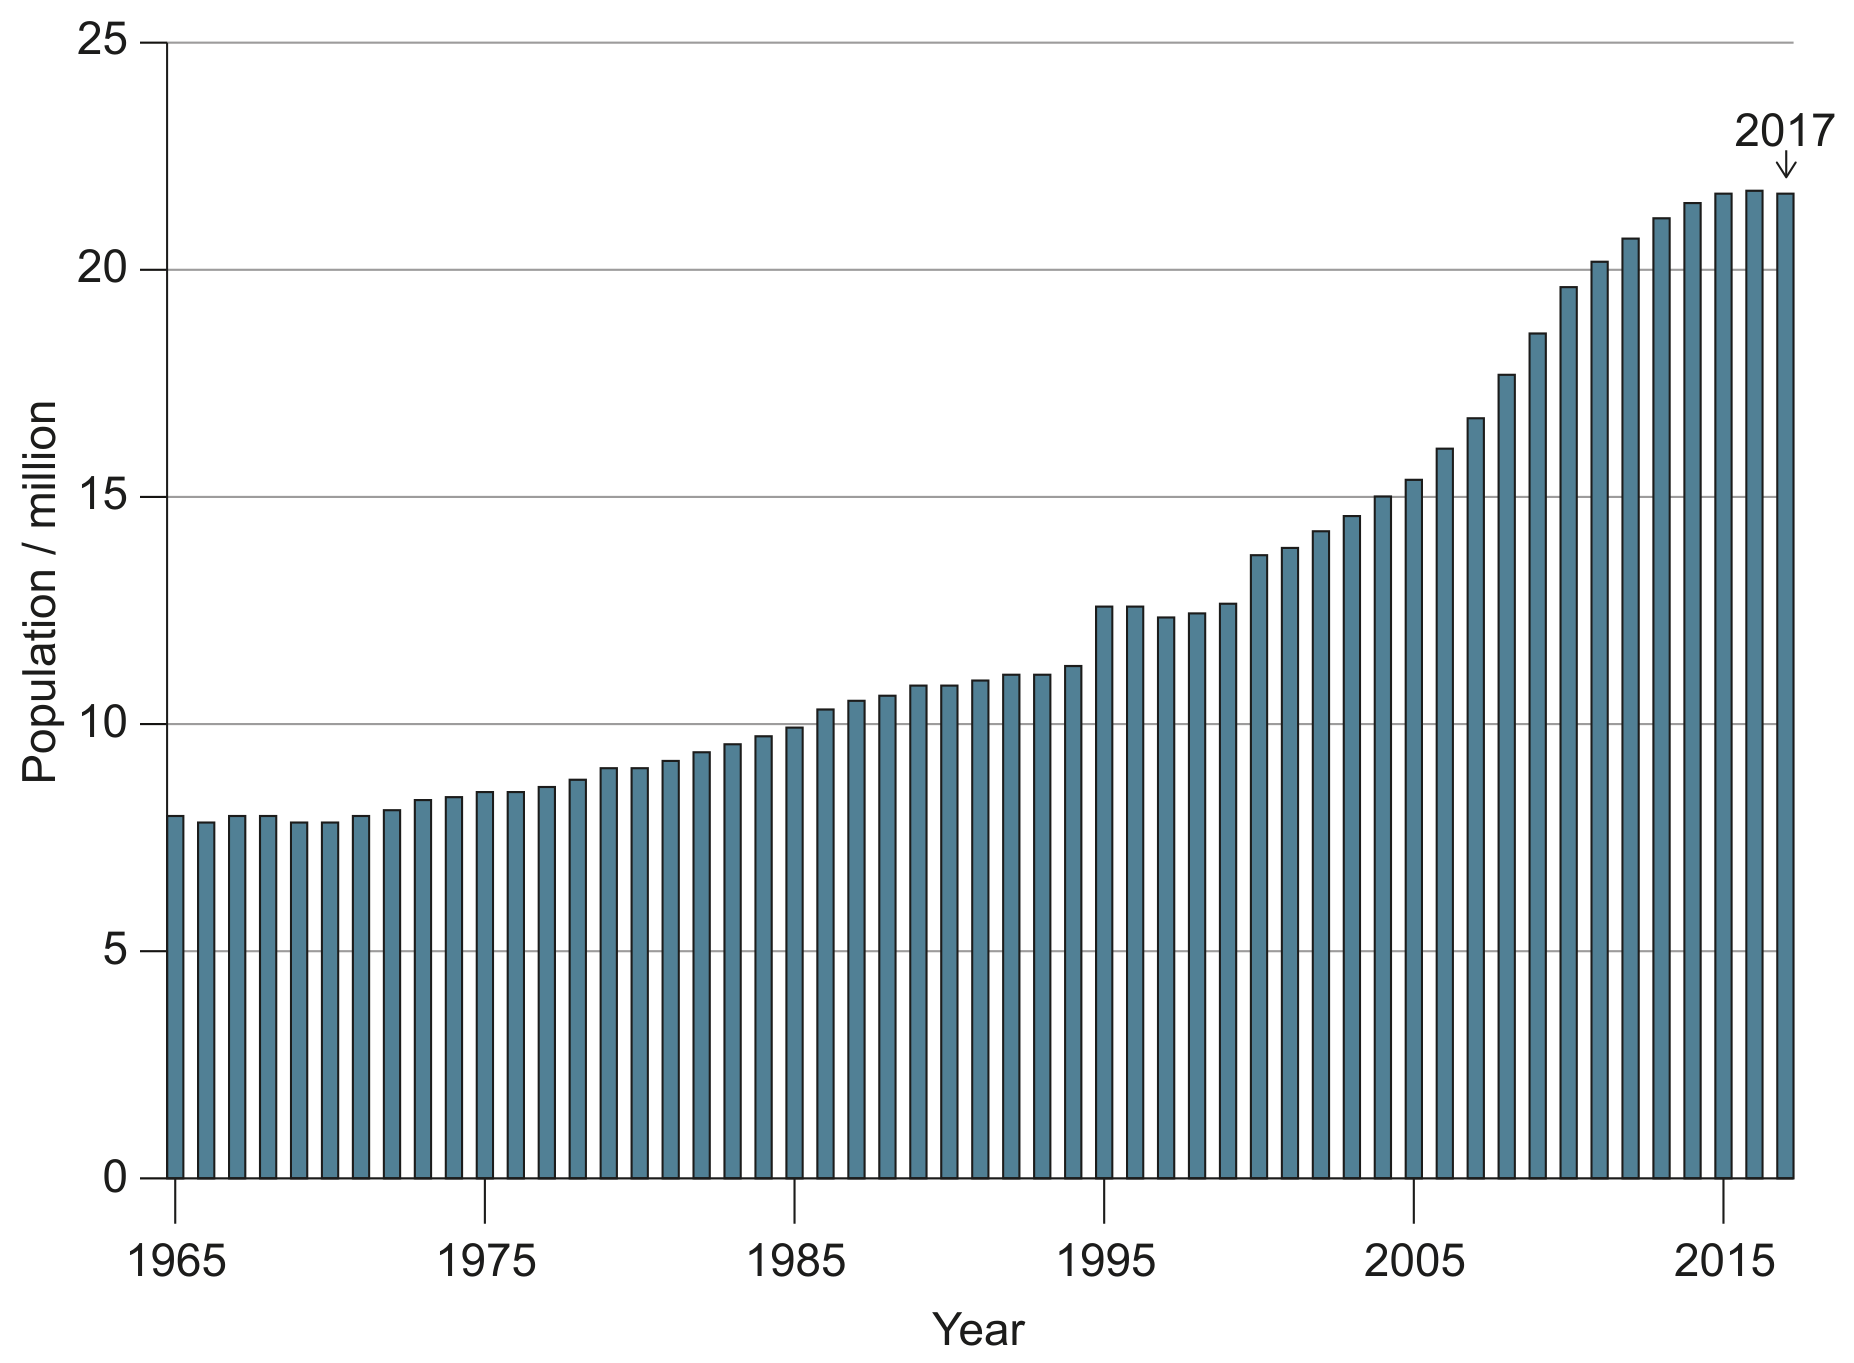
Figure 3(b): Beijing population, 1965-2017
With reference to Figure 3(b), identify a year in which the population growth rate is negative.
Identify the stage of the demographic transition model represented by Figure 5.
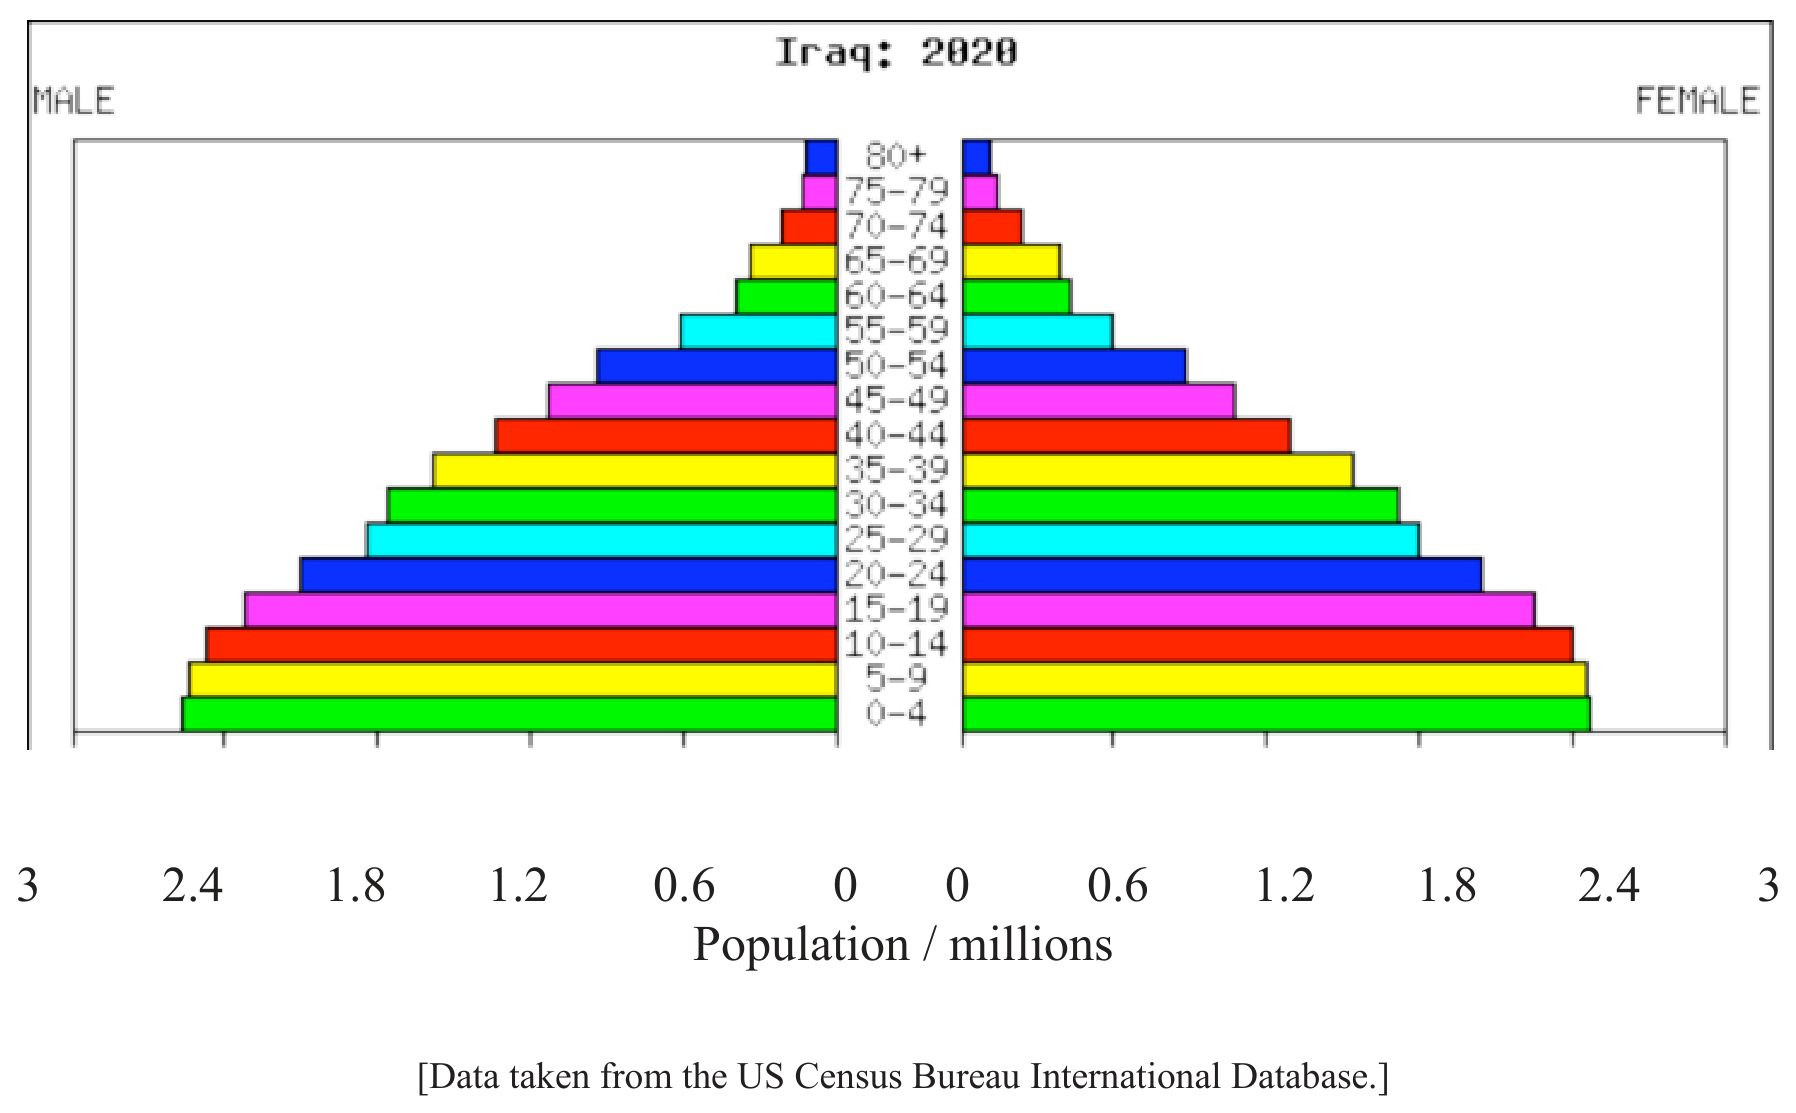
Figure 5: 2009 age/sex pyramid for Iraq
Outline why the shape of the population pyramid in Figure 3 indicates a high future population growth for Zambia.
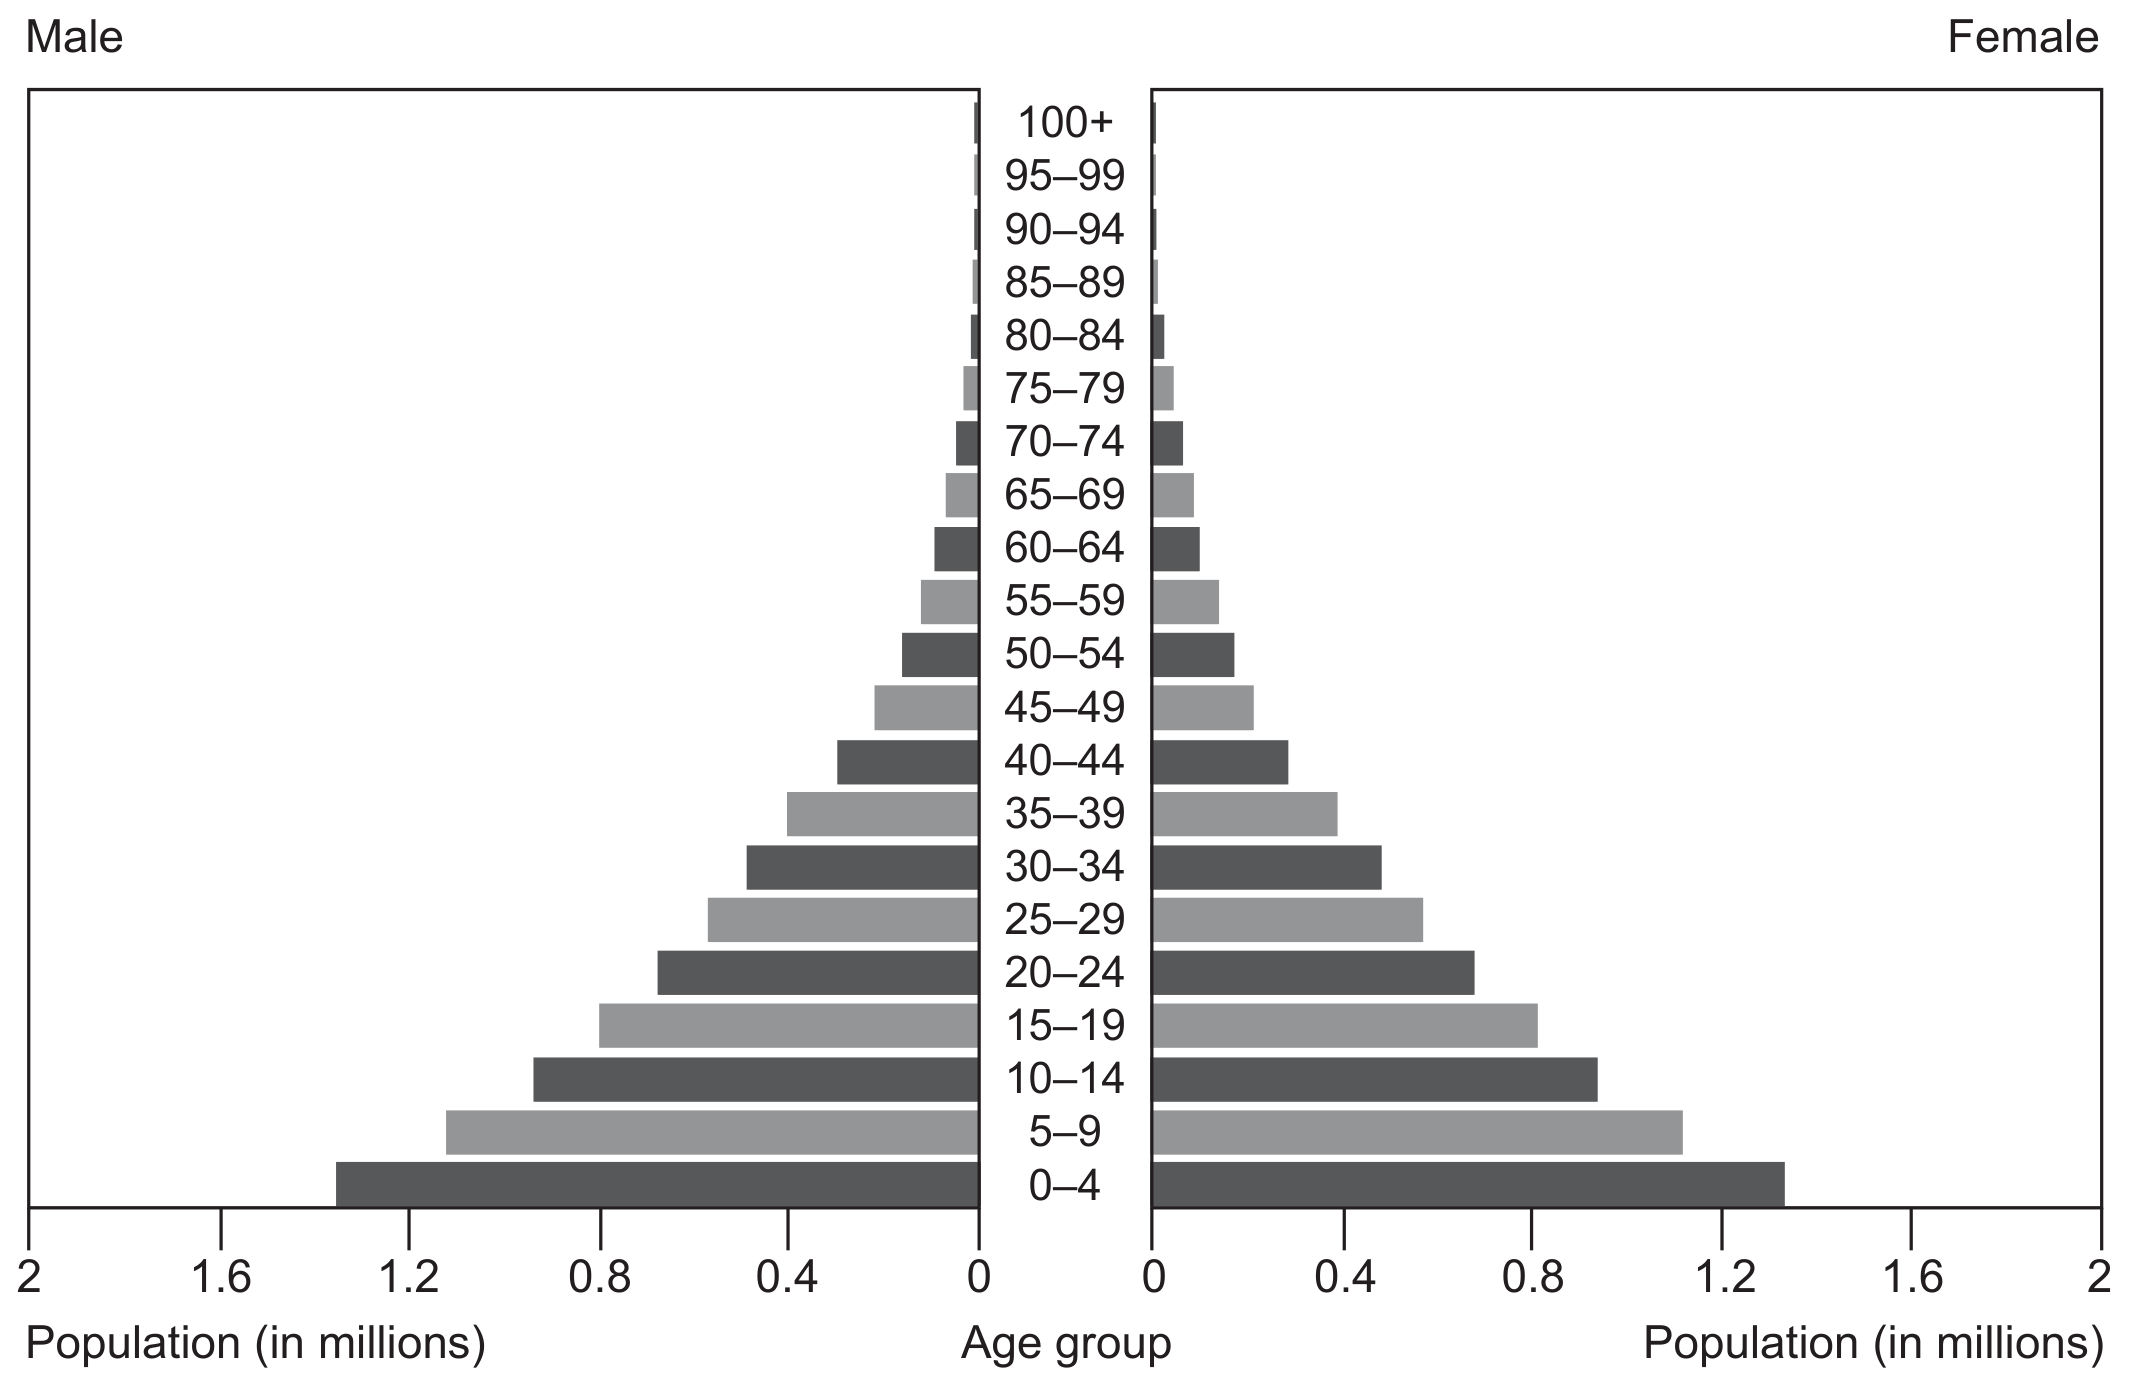
Figure 3: Population pyramid for Zambia, 2014
| Population (estimated) | 5 million (including 104000 indigenous people) |
|---|---|
| Natural increase rate | 1.05\% |
| Crude birth rate | 15.3/1000 |
| Crude death rate | 4.8/1000 |
| Life expectancy / years | 78.9 |
| Total fertility rate | 1.89 (Note: In 1973, total fertility rate was 5.6) |
Figure 4(a): Demographic data for 2018
Based on the 2018 data in Figure 4(a), calculate the doubling time for the population of Costa Rica.
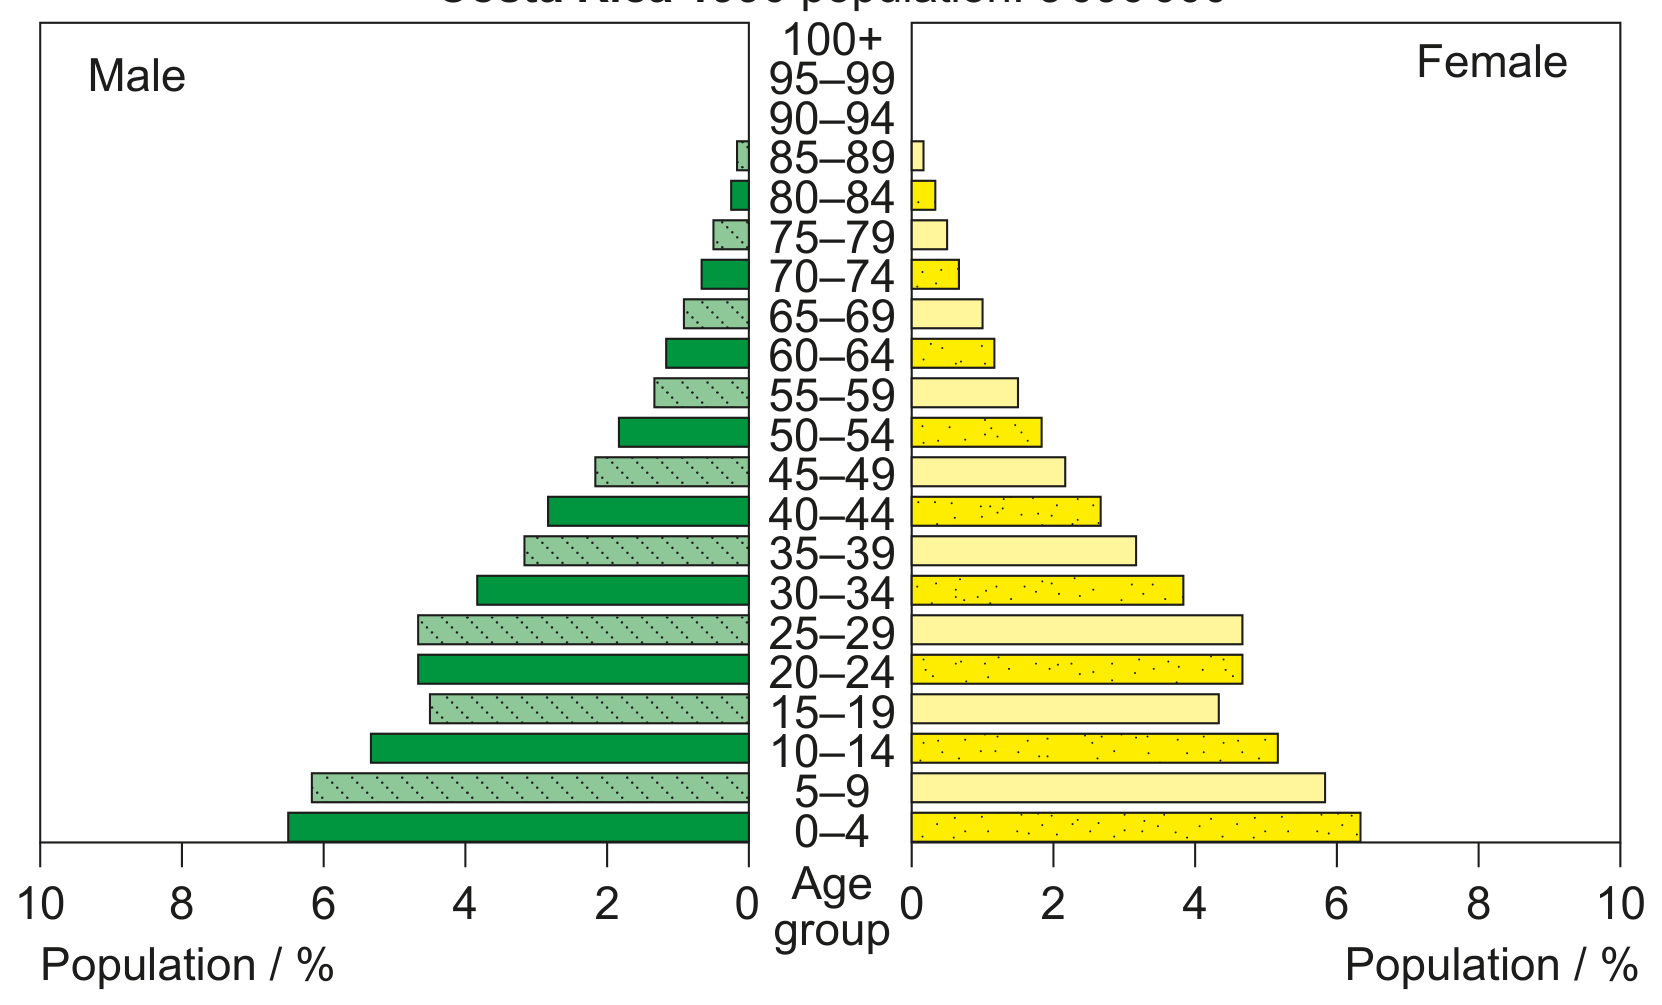
Figure 4(b): Age-gender pyramid for Costa Rica in 1990 and projected pyramids for 2020 and 2050
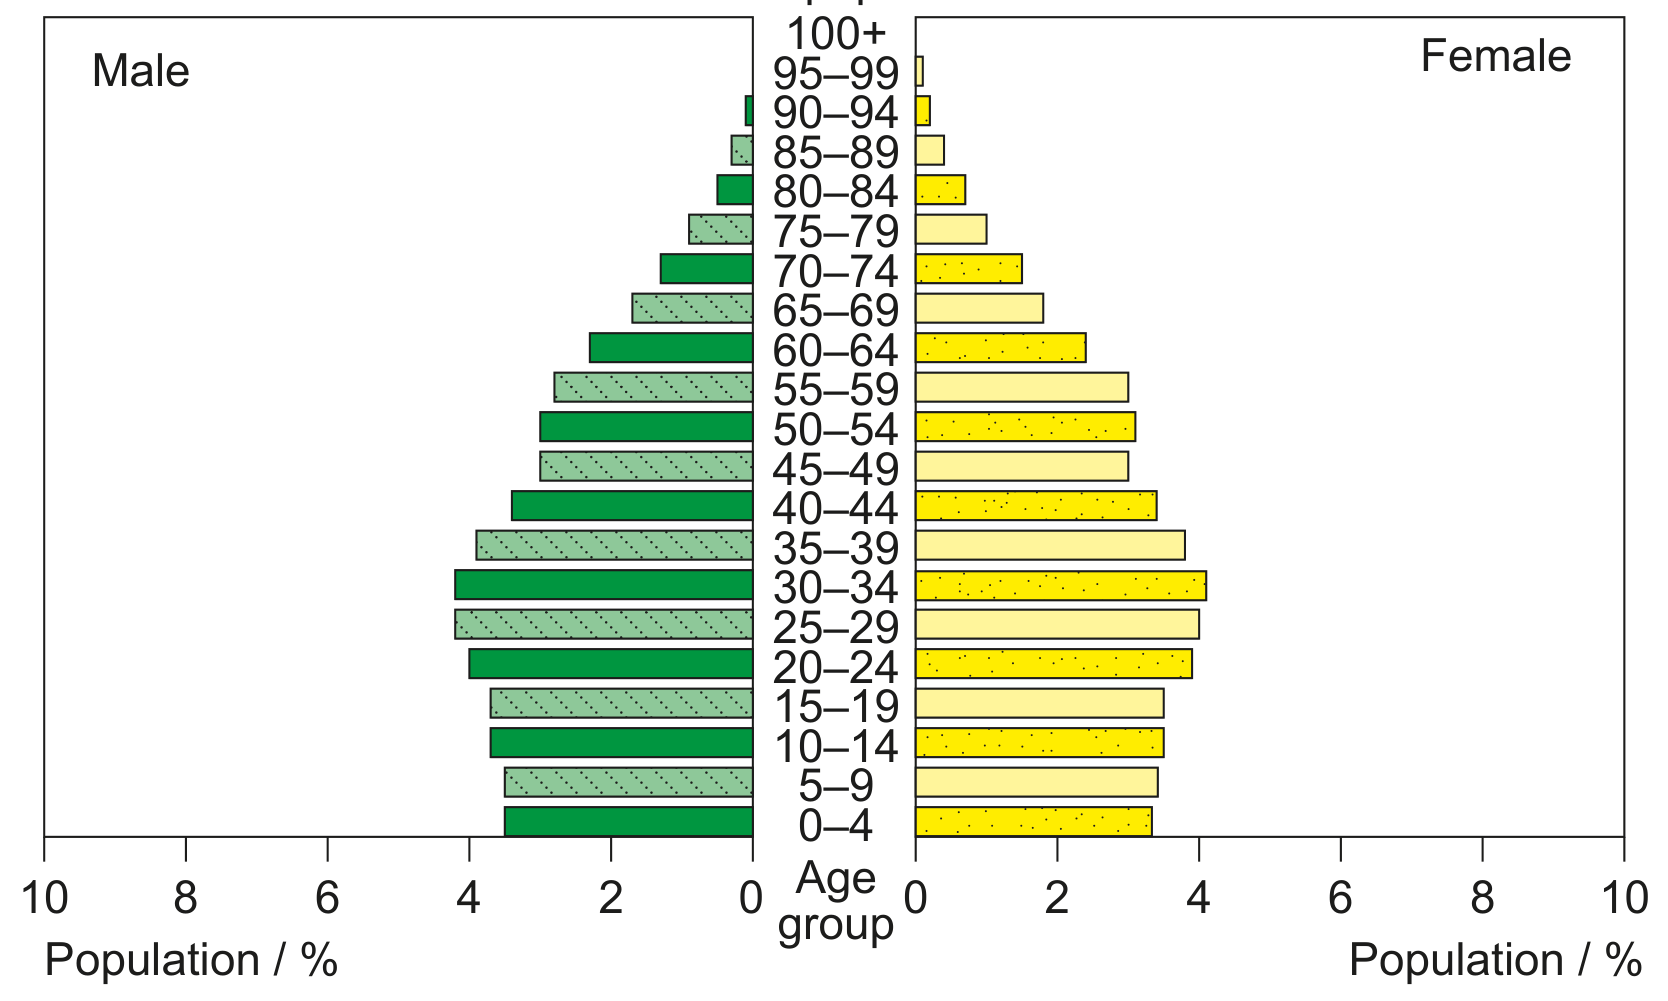
(Figure 4(b) continued)
Costa Rica 2050 population: 5760000
With reference to Figure 4(b), suggest three possible reasons for the changes between the age-gender pyramid for 1990 and that projected for 2050.
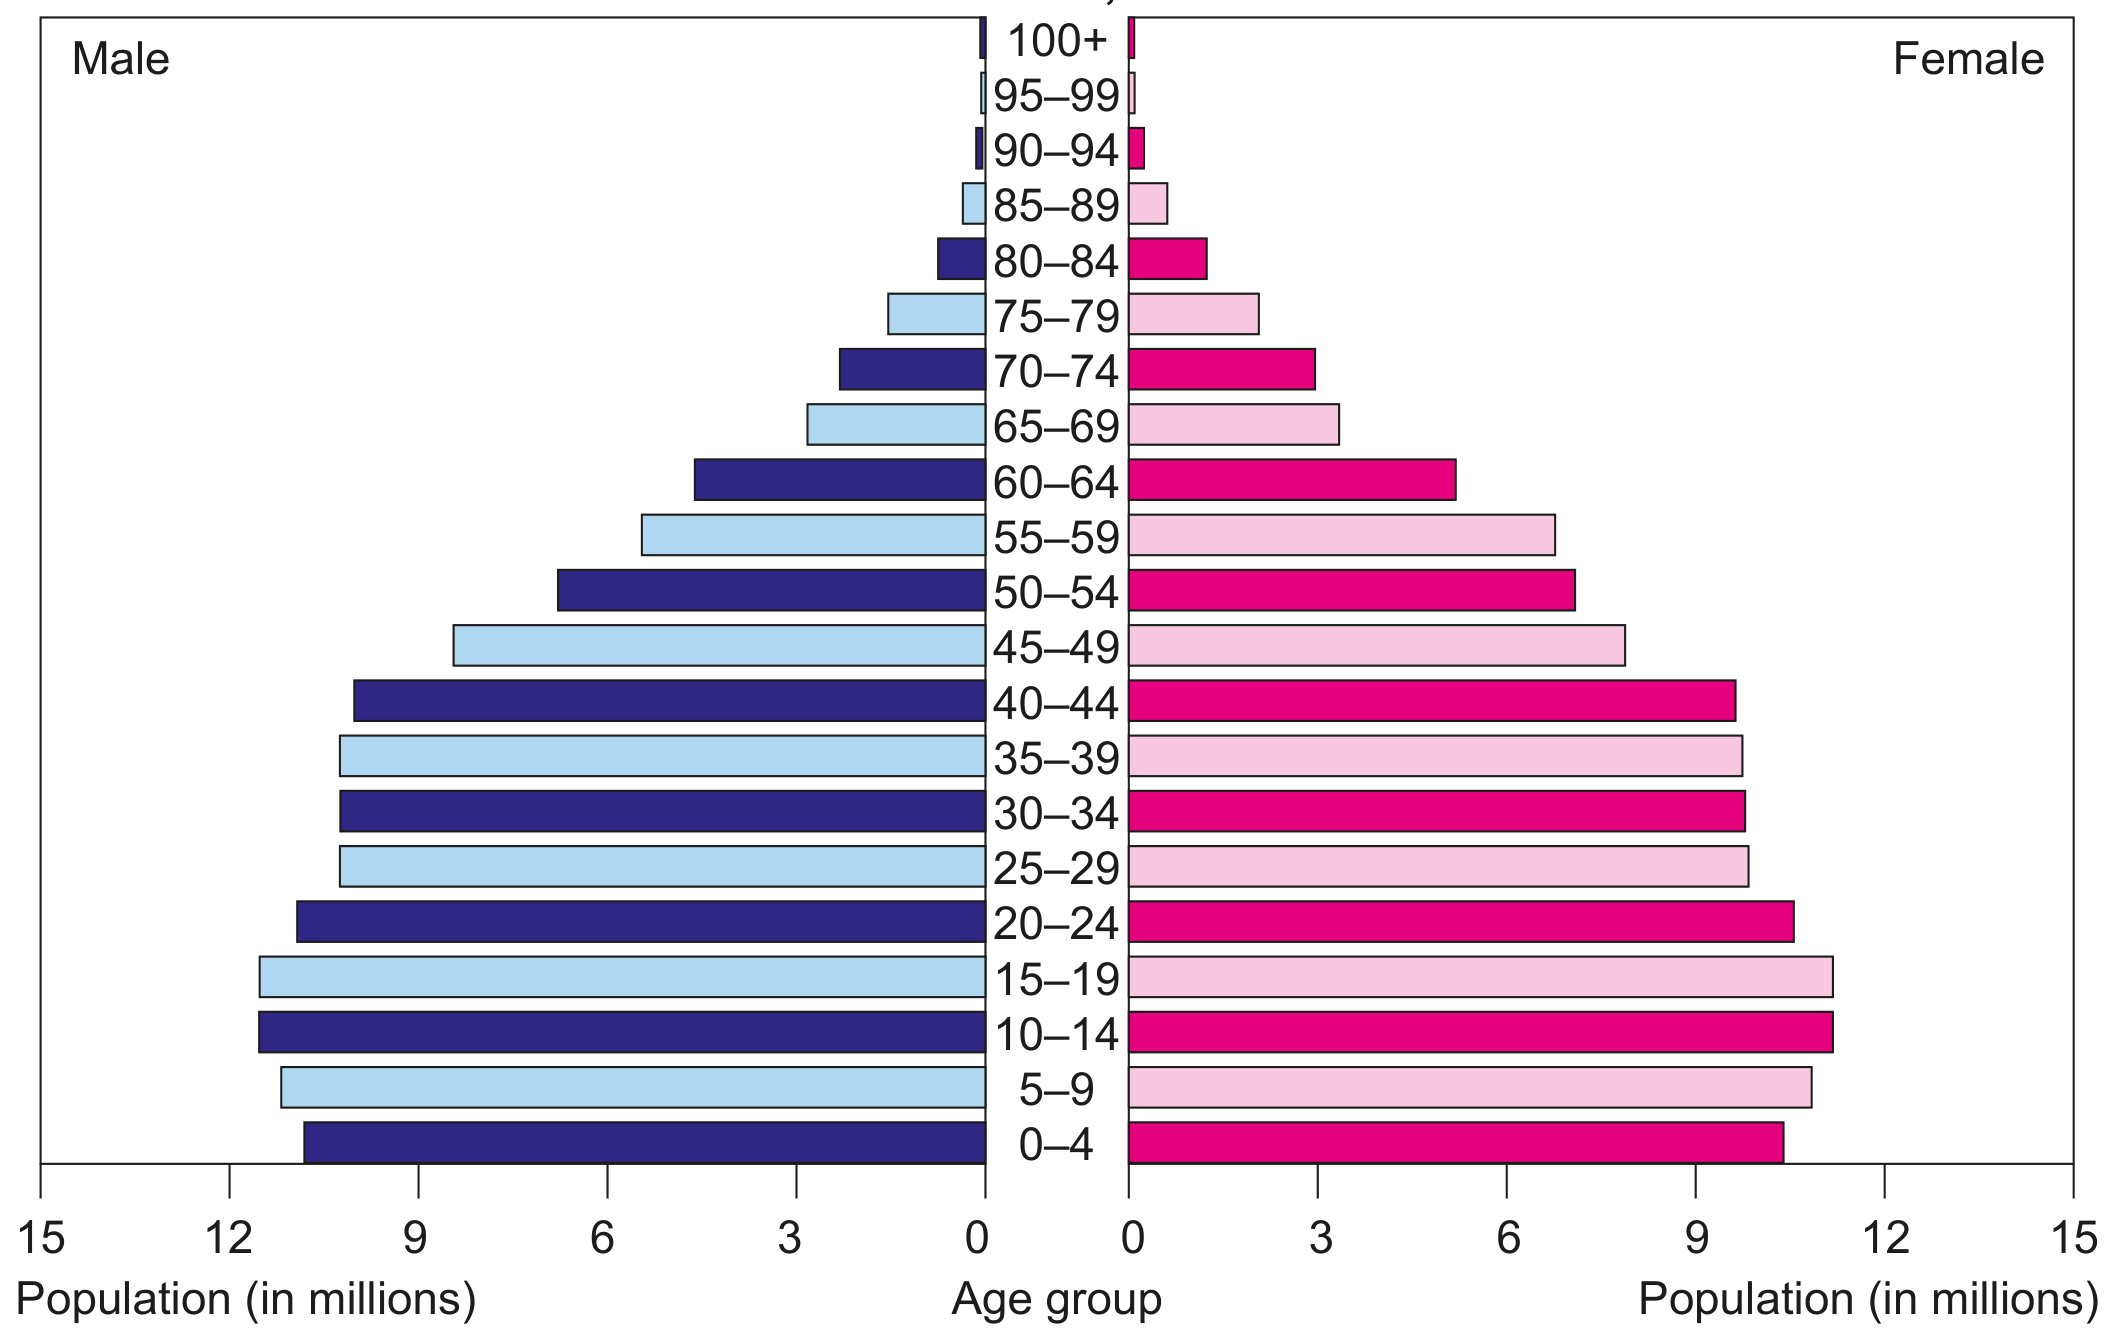
Figure 3(b): Age-gender pyramid for Indonesia, 2016
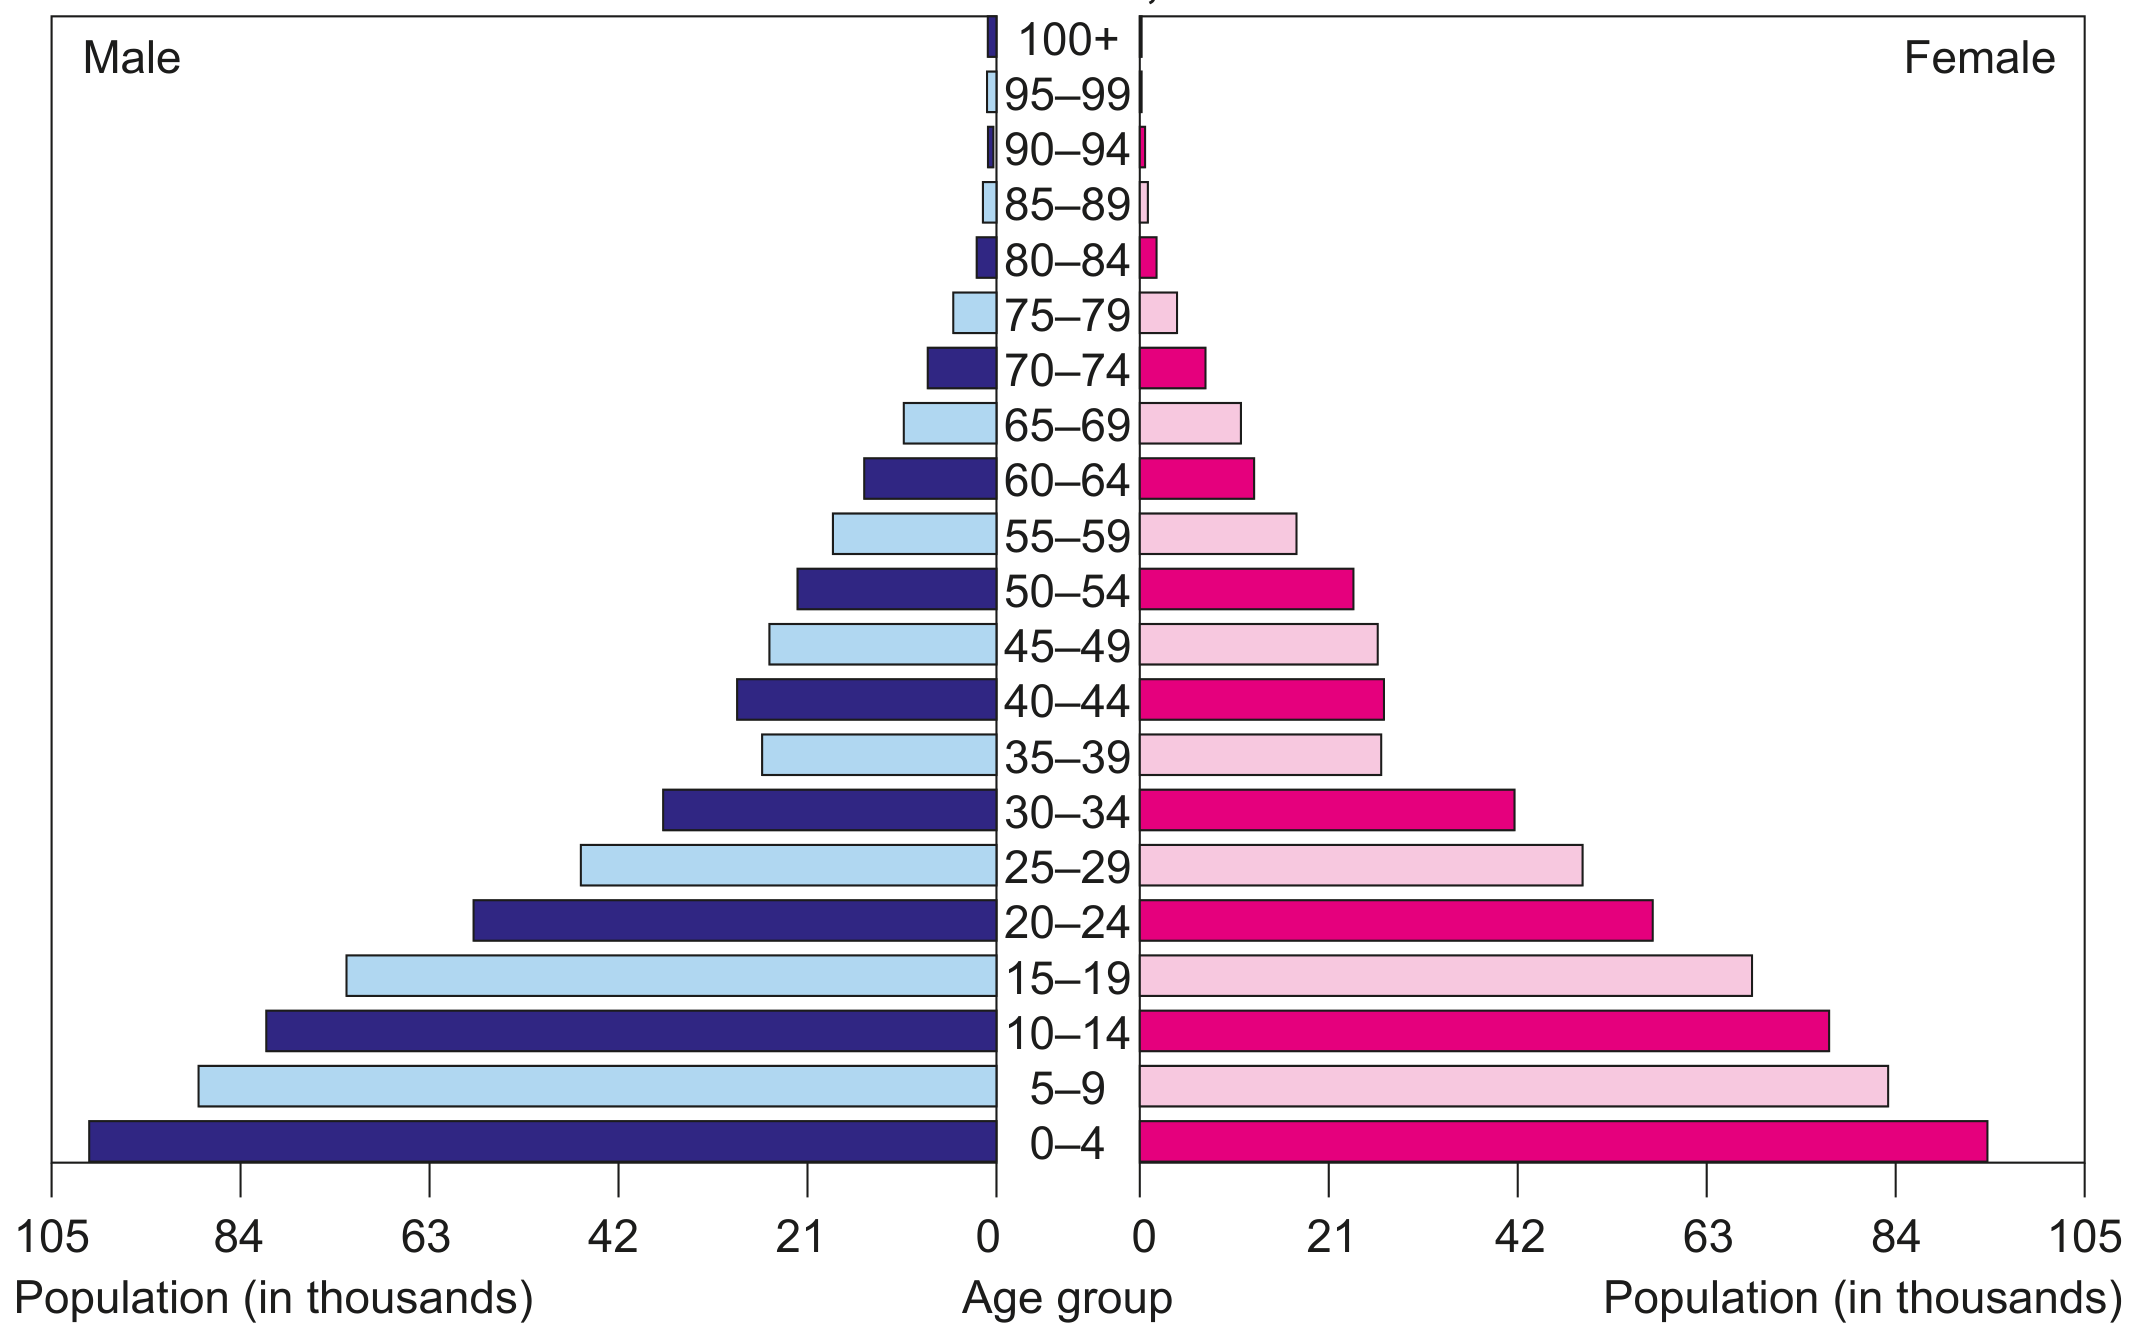
Figure 3(b): Age-gender pyramid for Timor-Leste, 2016
With reference to Figure 3(b), outline two reasons for differences between the age-gender pyramids for Indonesia and Timor-Leste.
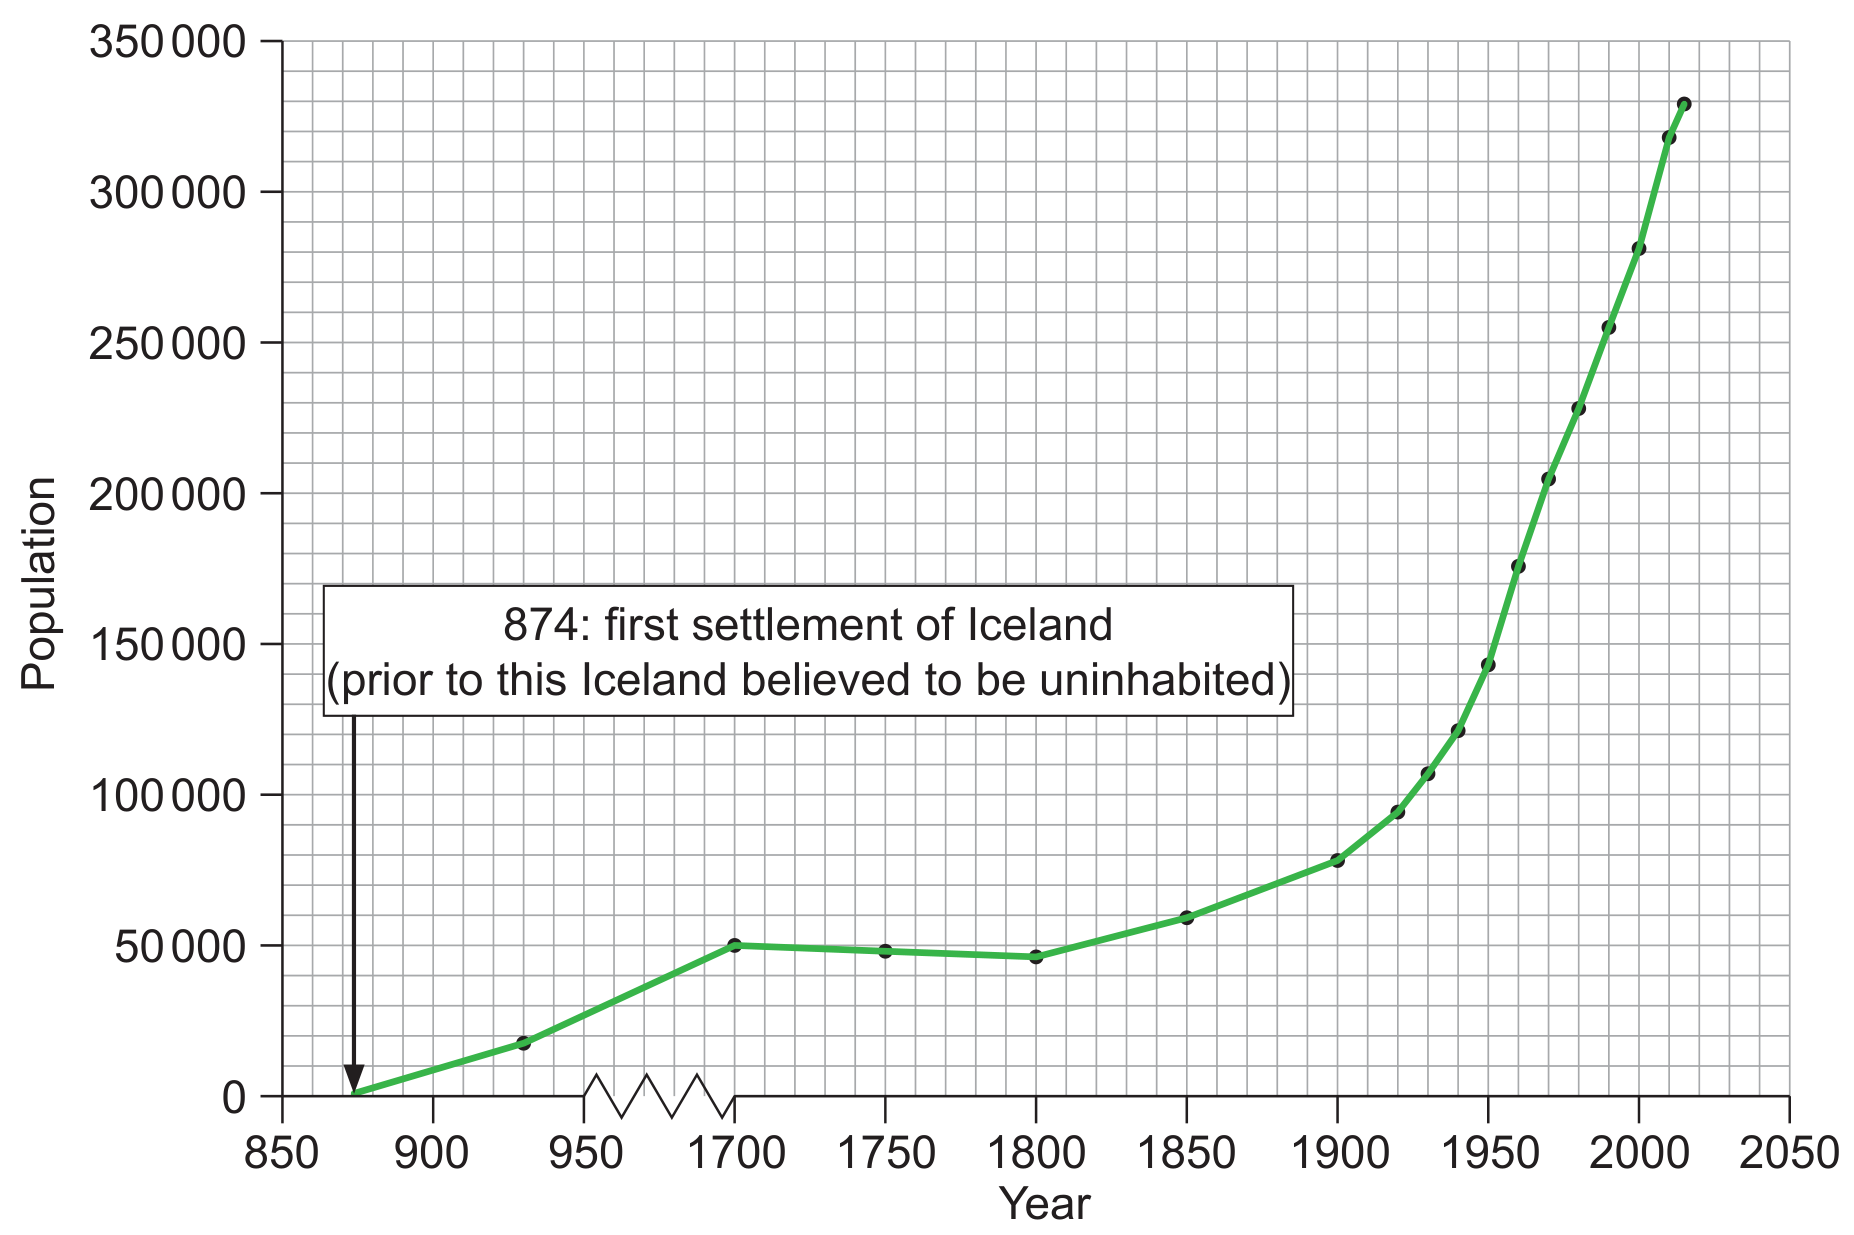
Figure 3(a): Graph showing Icelandic population change over time
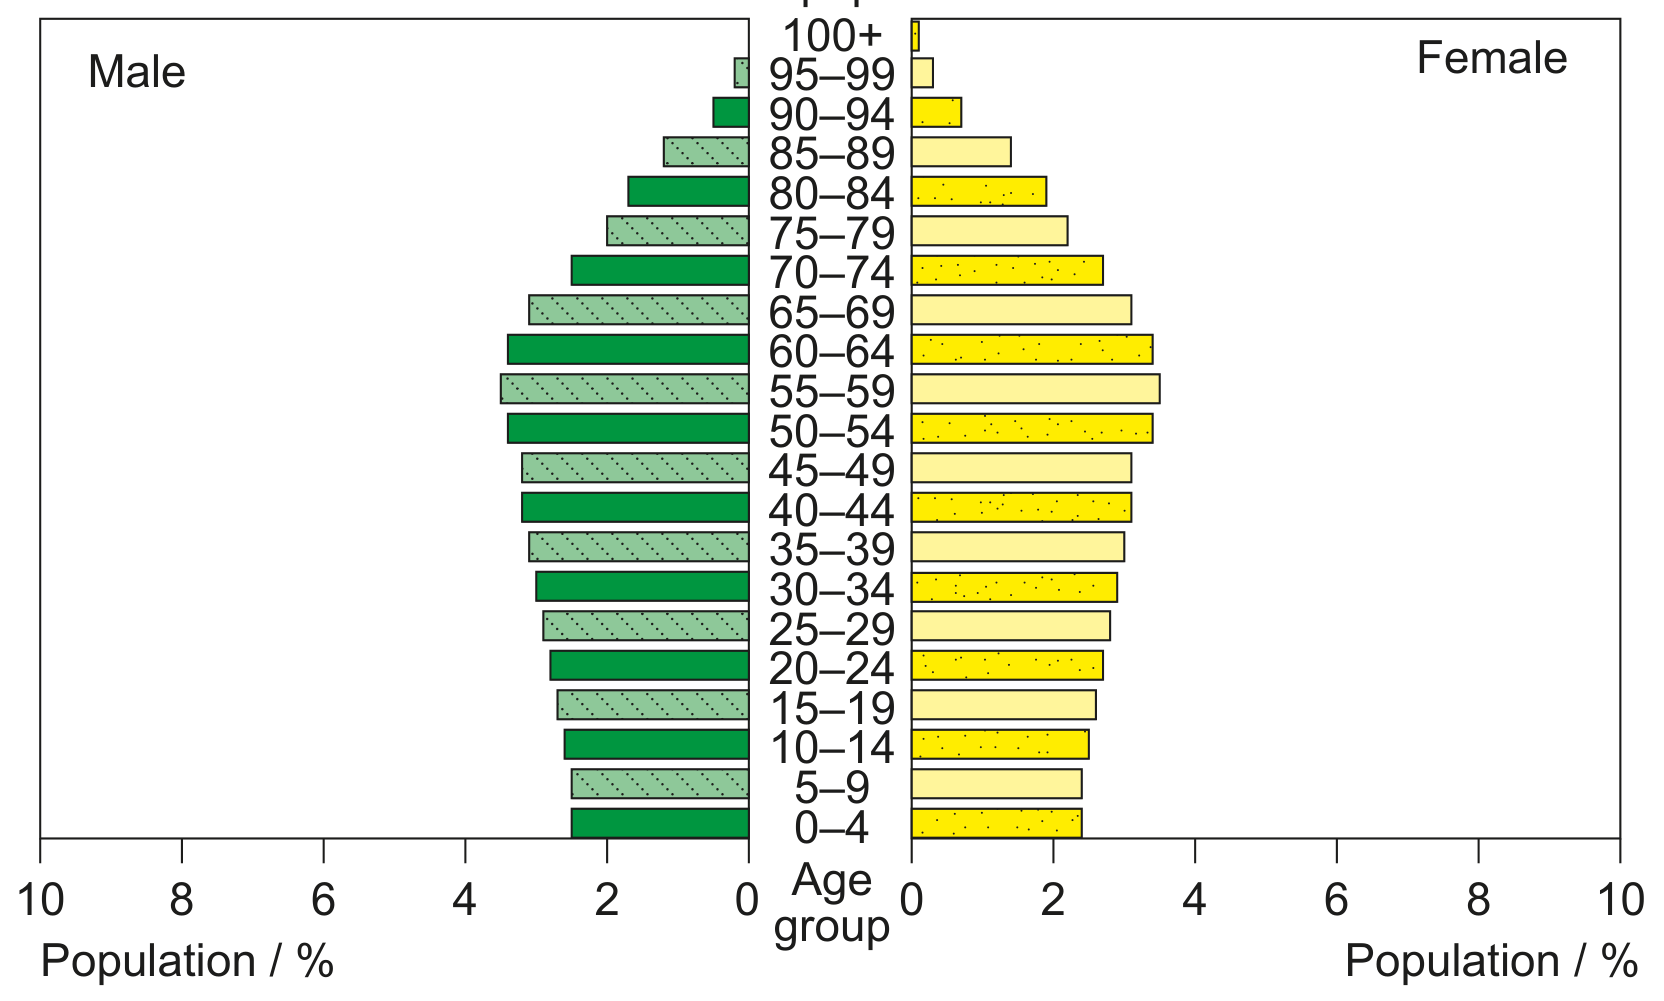
Figure 3(b): Age-gender pyramid for Iceland in 2014
With reference to Figures 3(a) and 3(b) describe the trends in Iceland's population dynamics.