Question 1
[Maximum number: 7]
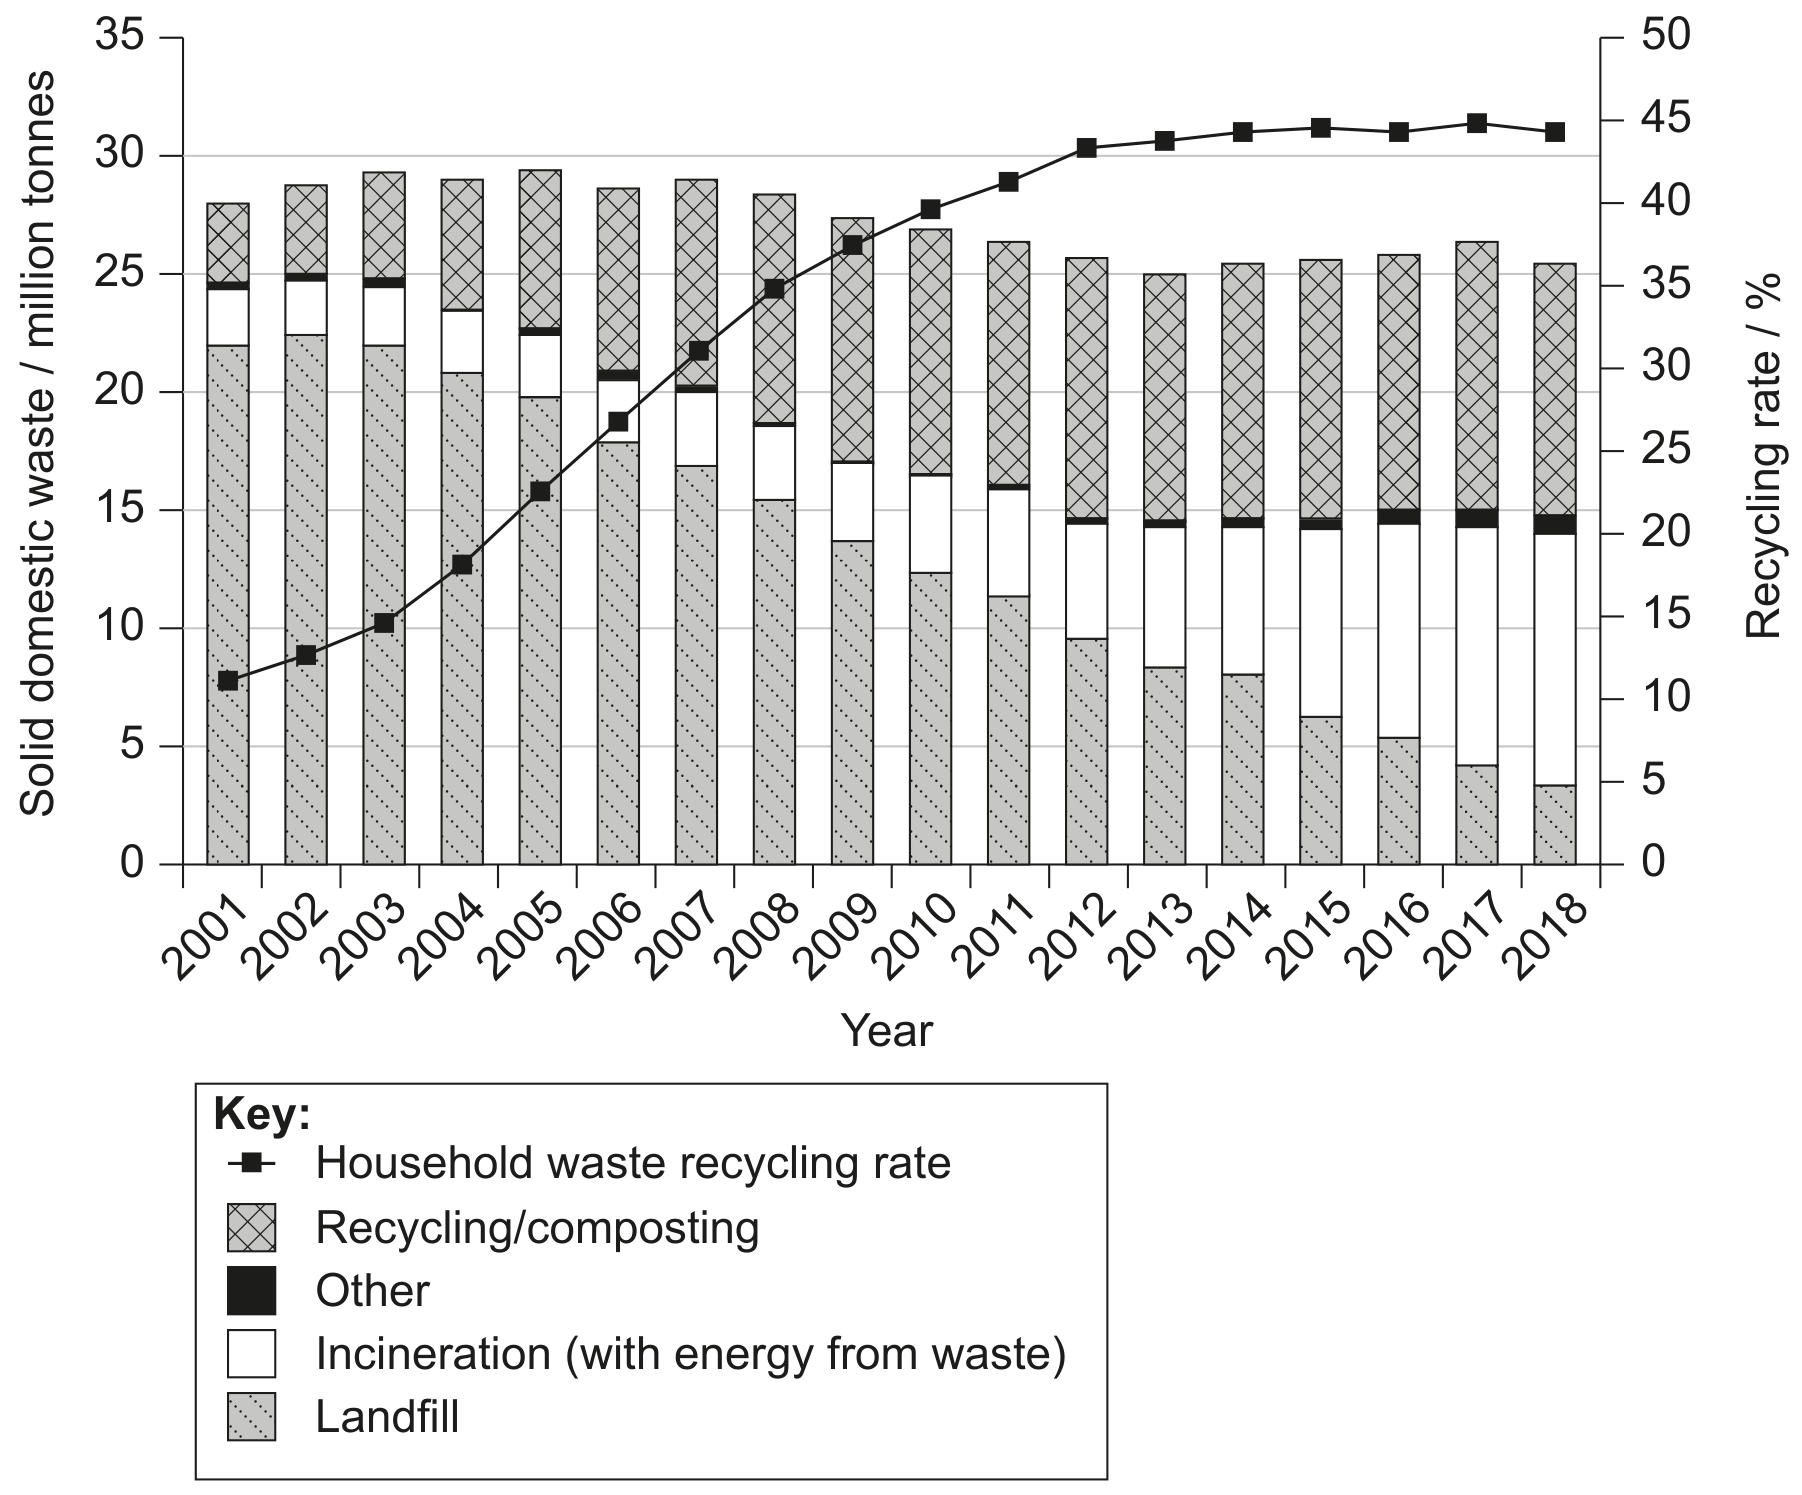
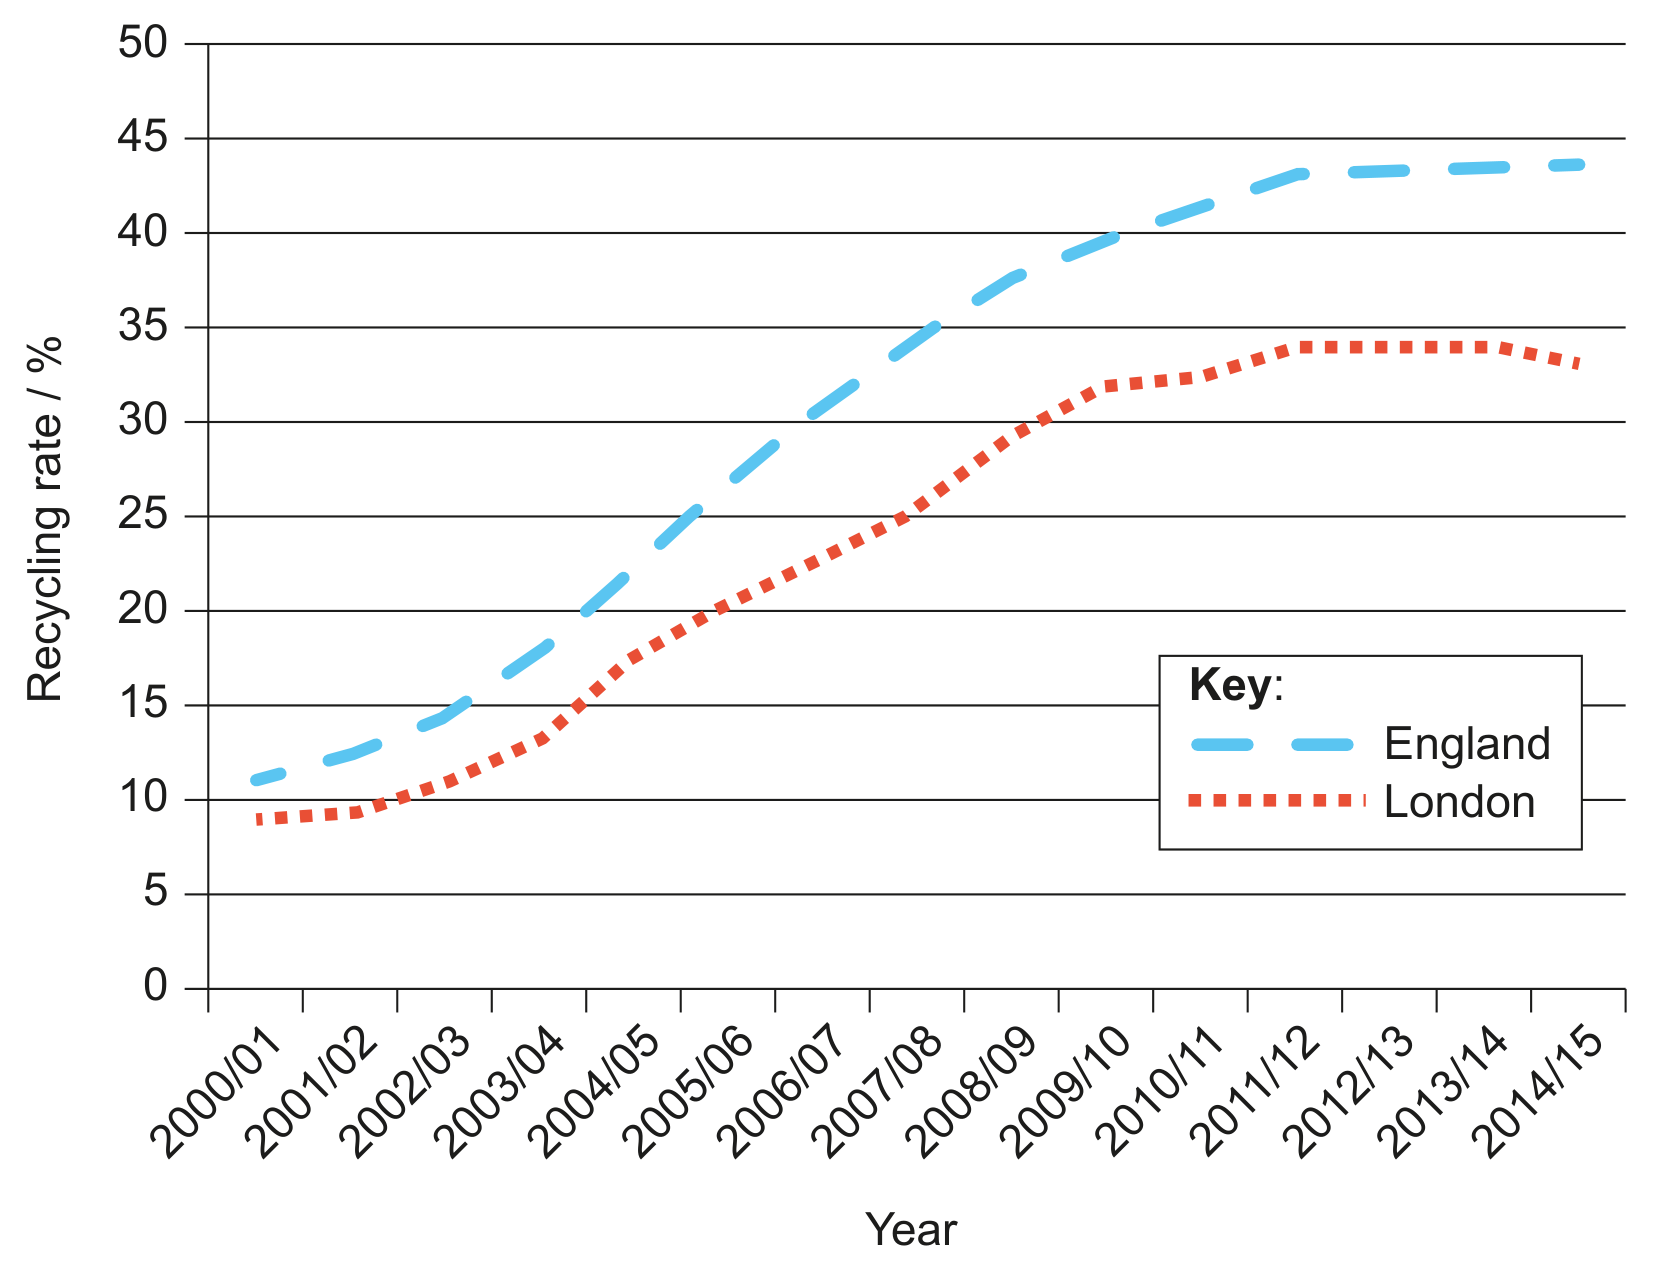
Figure 1: Management of solid domestic waste in England, 2001-2018
Question 1(a)
(a)
With reference to Figure 1, identify the recycling rate in England in 2018.
[ 1 ]
Question 1(b)
(b)
Outline one reason for the shape of the recycling rate curve from 2013 to 2018.
[ 1 ]
Question 1(c)
(c)
Estimate the reduction in solid domestic waste (in million tonnes) going to landfill from 2001 to 2018.
[ 1 ]
Question 1(d)
(d)
Describe three reasons why the proportion of solid domestic waste being recycled/ composted and incinerated has changed.
[ 3 ]
Question 1(e)
(e)
Outline one reason why there has been an overall change in recorded total solid domestic waste between 2001 and 2018.
[ 1 ]