Question 1
Question 1(g)
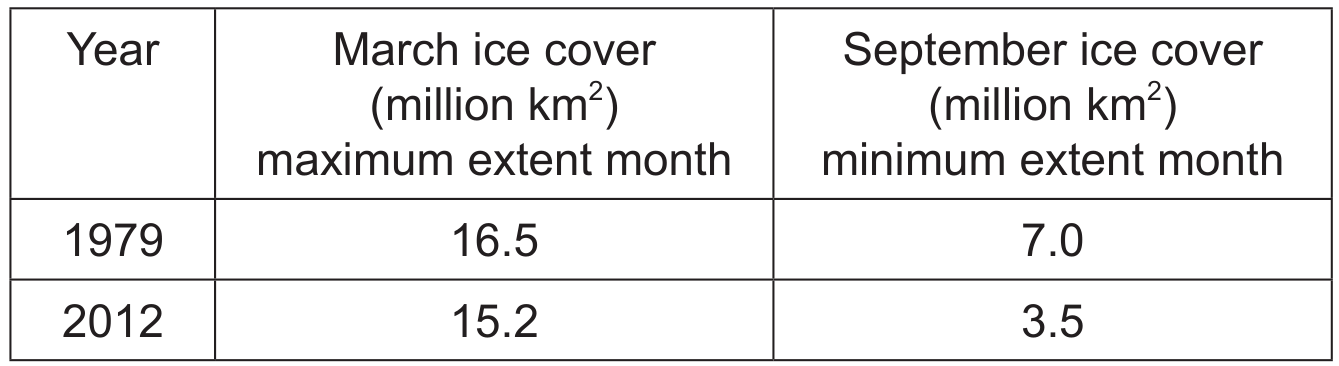
Explain why the people of the Niger Delta may be particularly badly affected by global warming in the future.
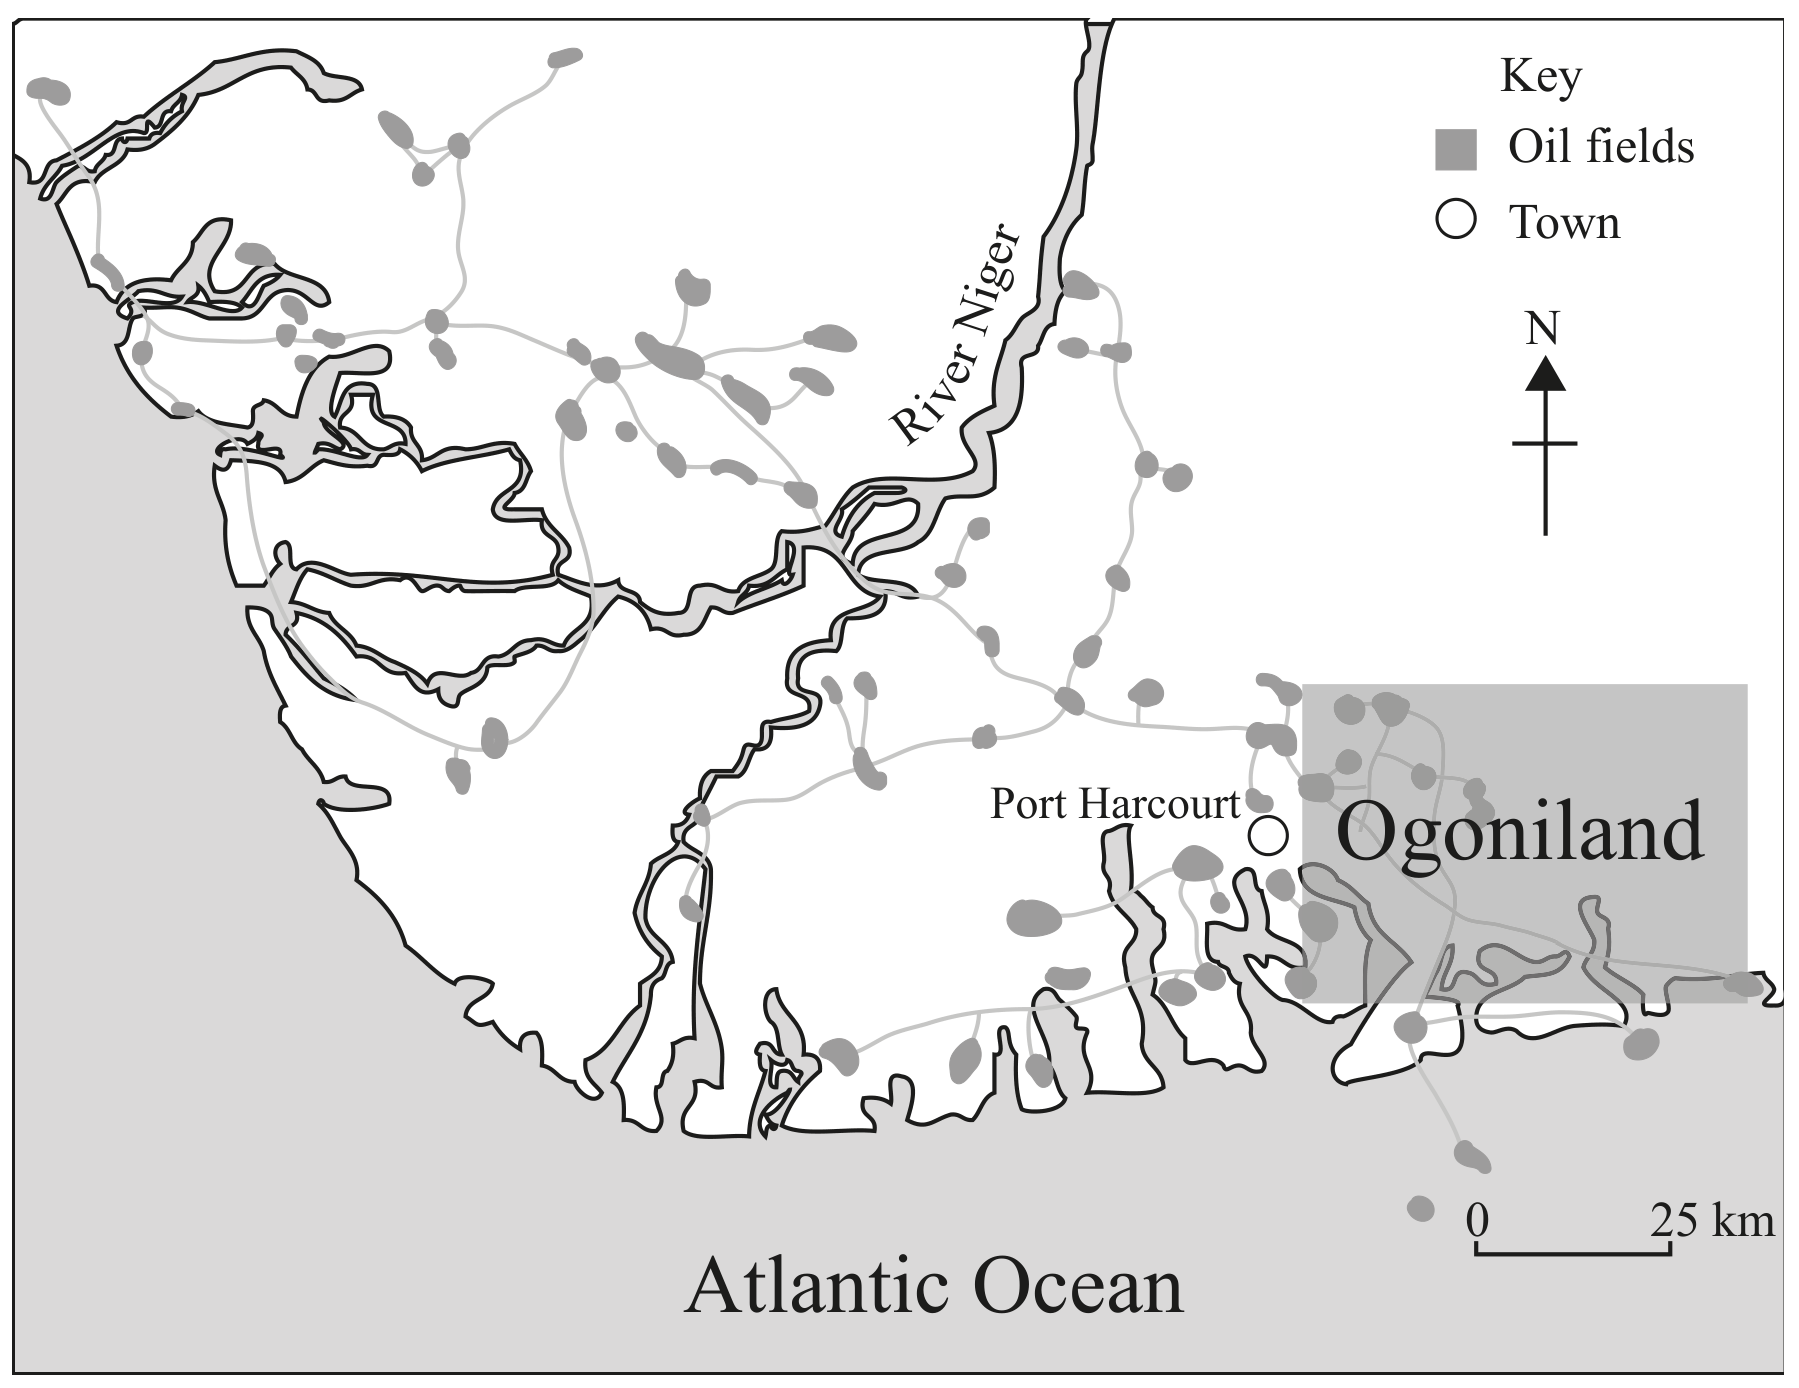
Figure 1: Regional map of the Niger Delta and Ogoniland case study area
The biome forms on a low-lying coastal delta from sediment deposited by the Niger River. Over 80% of the delta floods seasonally and swamps remain when flood waters drain away. It has played an important role in the global economy through slave trade, palm oil and fossil fuels over 400 years. Selected organisms have critical/endangered conservation status. Flora and fauna have only been systematically surveyed since the 1980s. Endemic species include Niger Delta red colobus and Heslop’s pygmy hippopotamus. The delta may be a meeting point for chimpanzee populations. It includes 75% of Africa’s remaining mangrove forests. Swamp forests have no large-scale formal protection, although crocodiles and chimpanzees receive some protection.
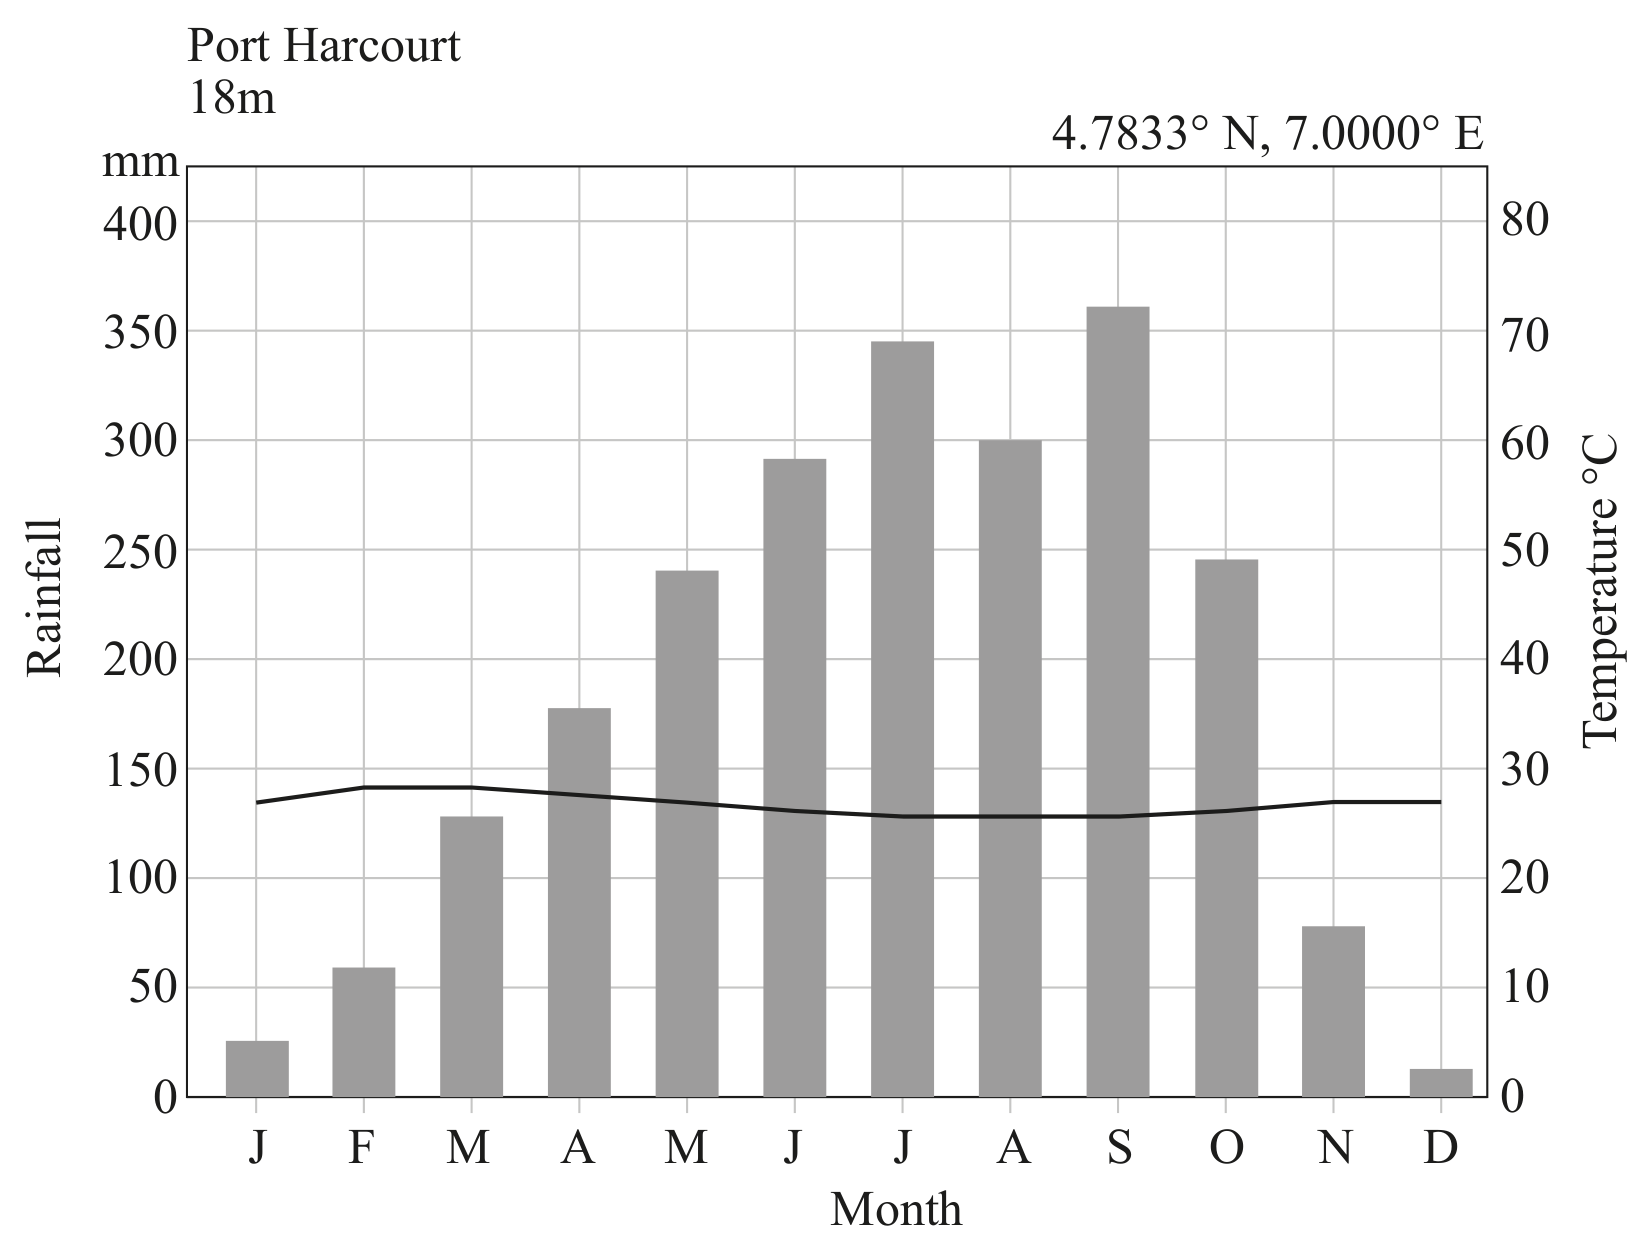
Figure 5(b): Climate graph for the Niger Delta
Over 1.5 million tonnes of oil have spilt in the delta over the past 50 years, polluting water sources, damaging crops and fishing grounds. The delta is one of the five most polluted spots on Earth. More than 20000 hectares of mangroves have been destroyed by oil exploration. Natural gas from oil fields is burnt off as flares, potentially causing acid deposition and global warming. There is limited access to electricity, fresh water and health care. The oil industry provides few jobs. Improved transport has enabled exploitation of timber and fish resources, leading to overfishing, habitat loss, overhunting and clashes. Local people hold the oil industry responsible, and pipelines/facilities are regularly attacked.