Question 1
Question 1(e)
(a)
Figure 4 shows the pattern of water use in Moldova. Water used in irrigation and raising livestock often does not return to the Danube, but evaporates. Suggest one possible impact of the failure to return water to the river.
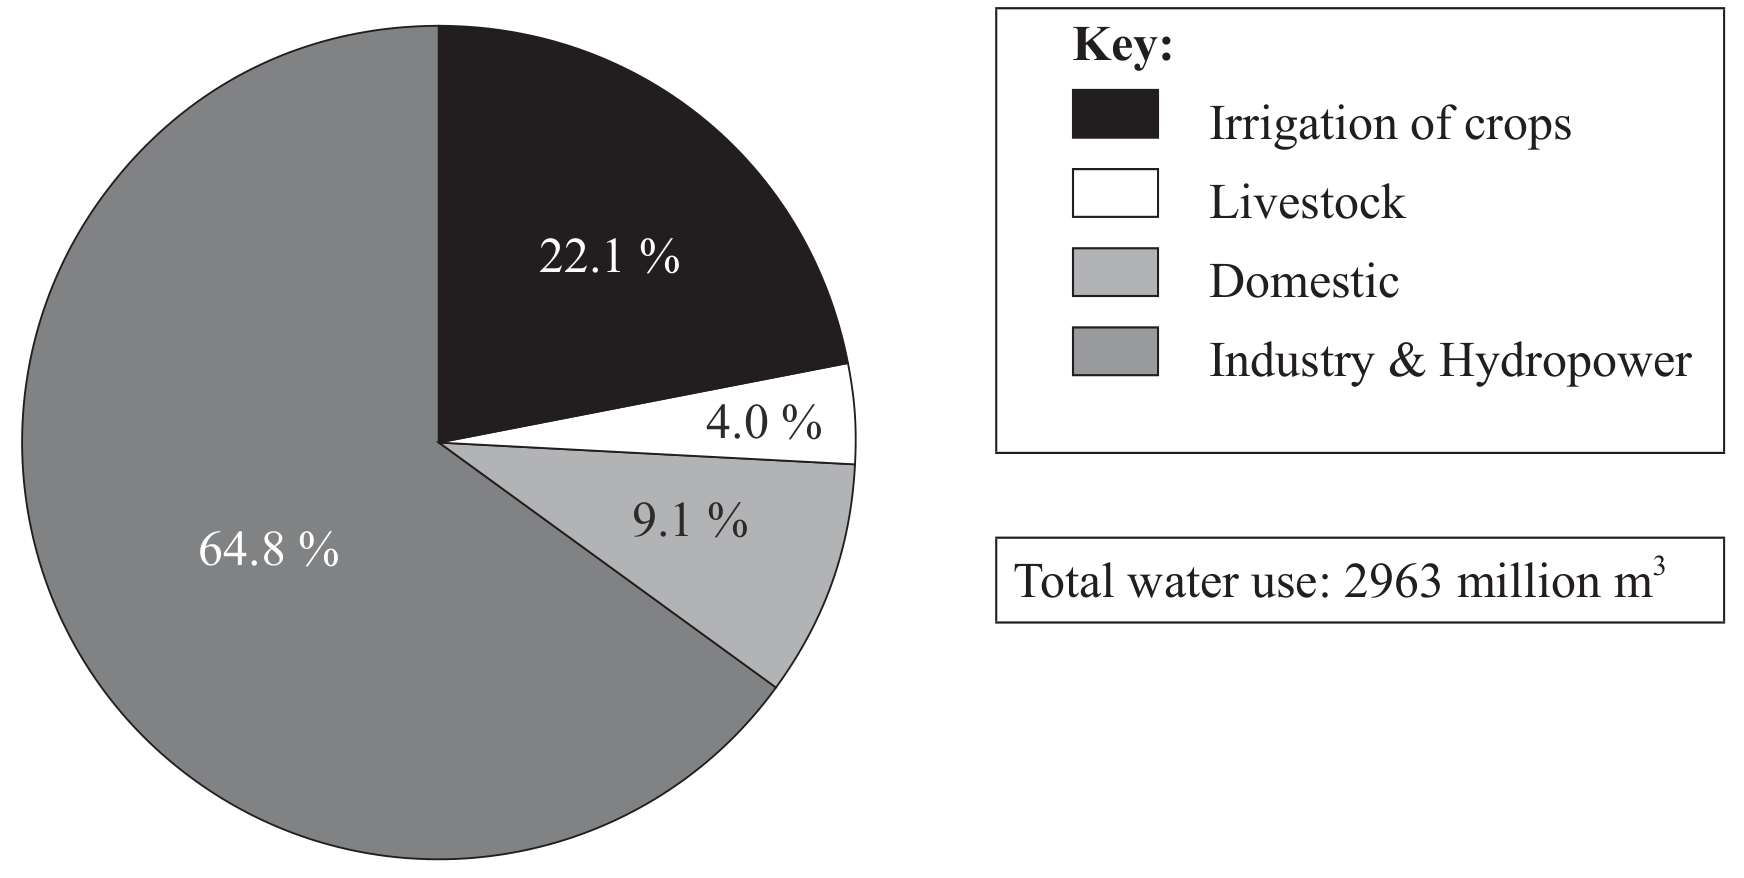
Figure 4: Water use in Moldova in 1992
Figure 4 shows Moldova water use in 1992: irrigation of crops is the largest use, followed by industry/hydropower, domestic use and livestock. The total water use shown is 596.5 million m^3.
[ 1 ]