Question 1
[Maximum number: 8]
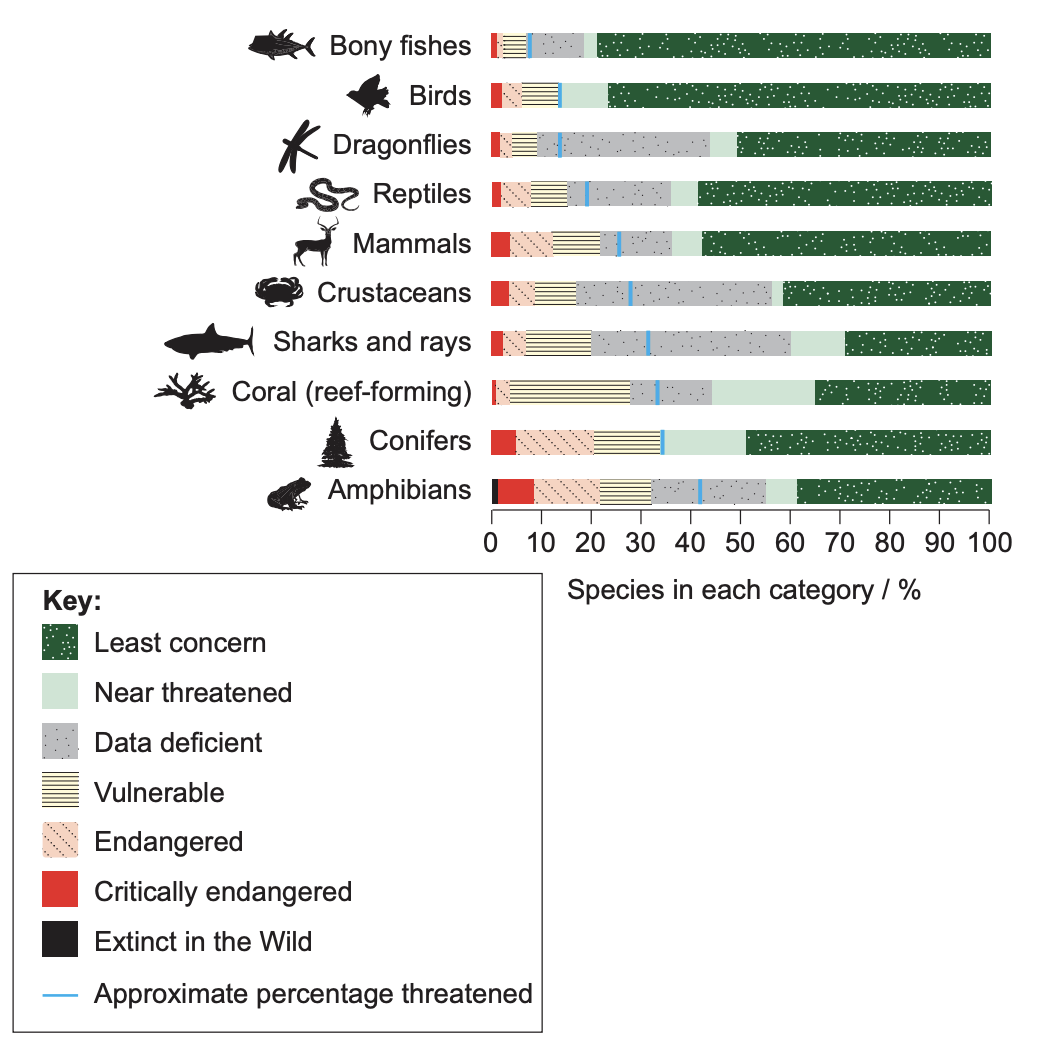
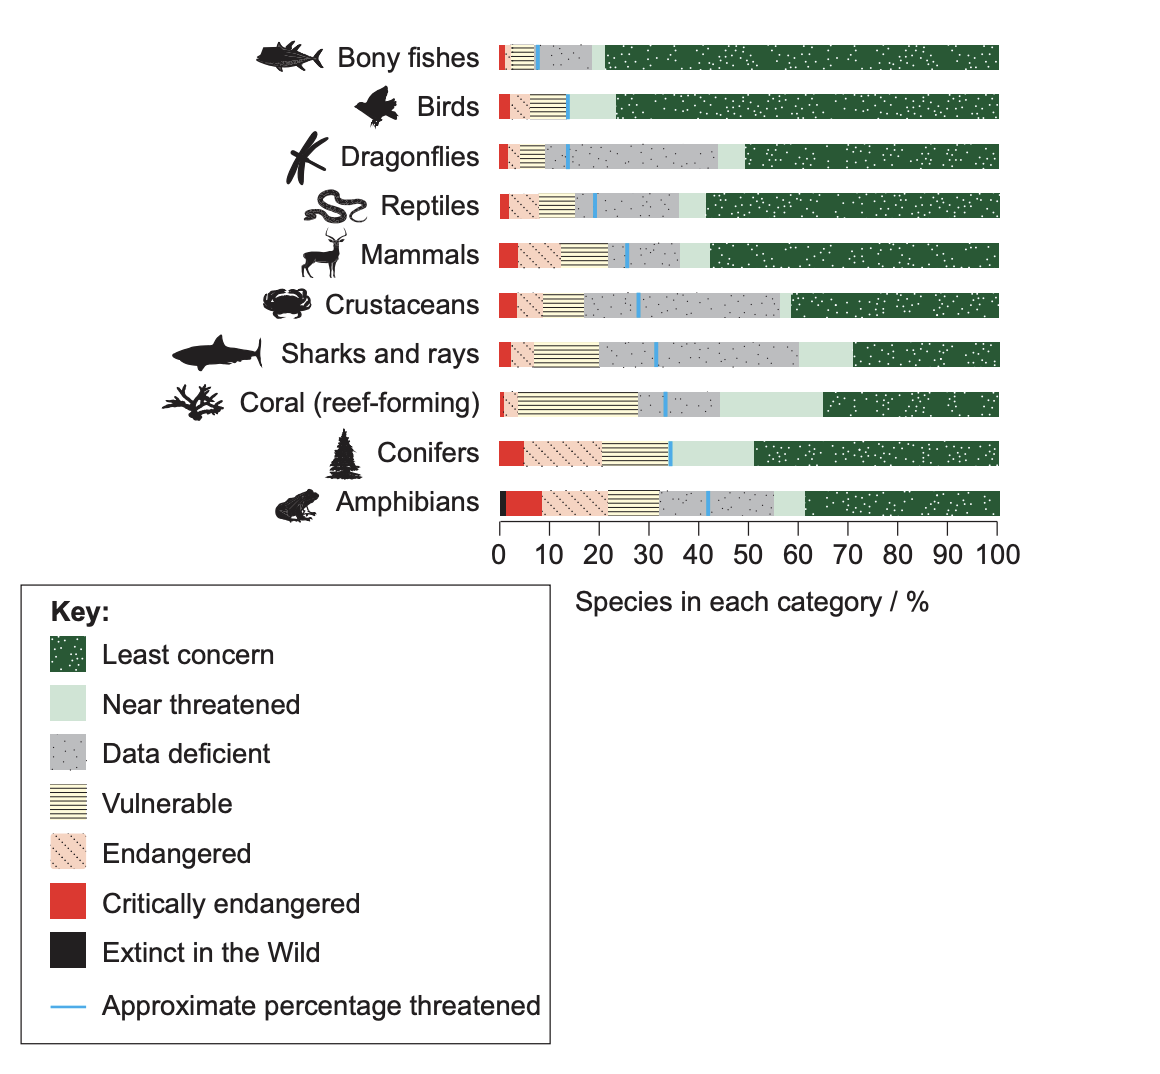
Figure 1(a): Extinction risk levels of species in global biodiversity by category
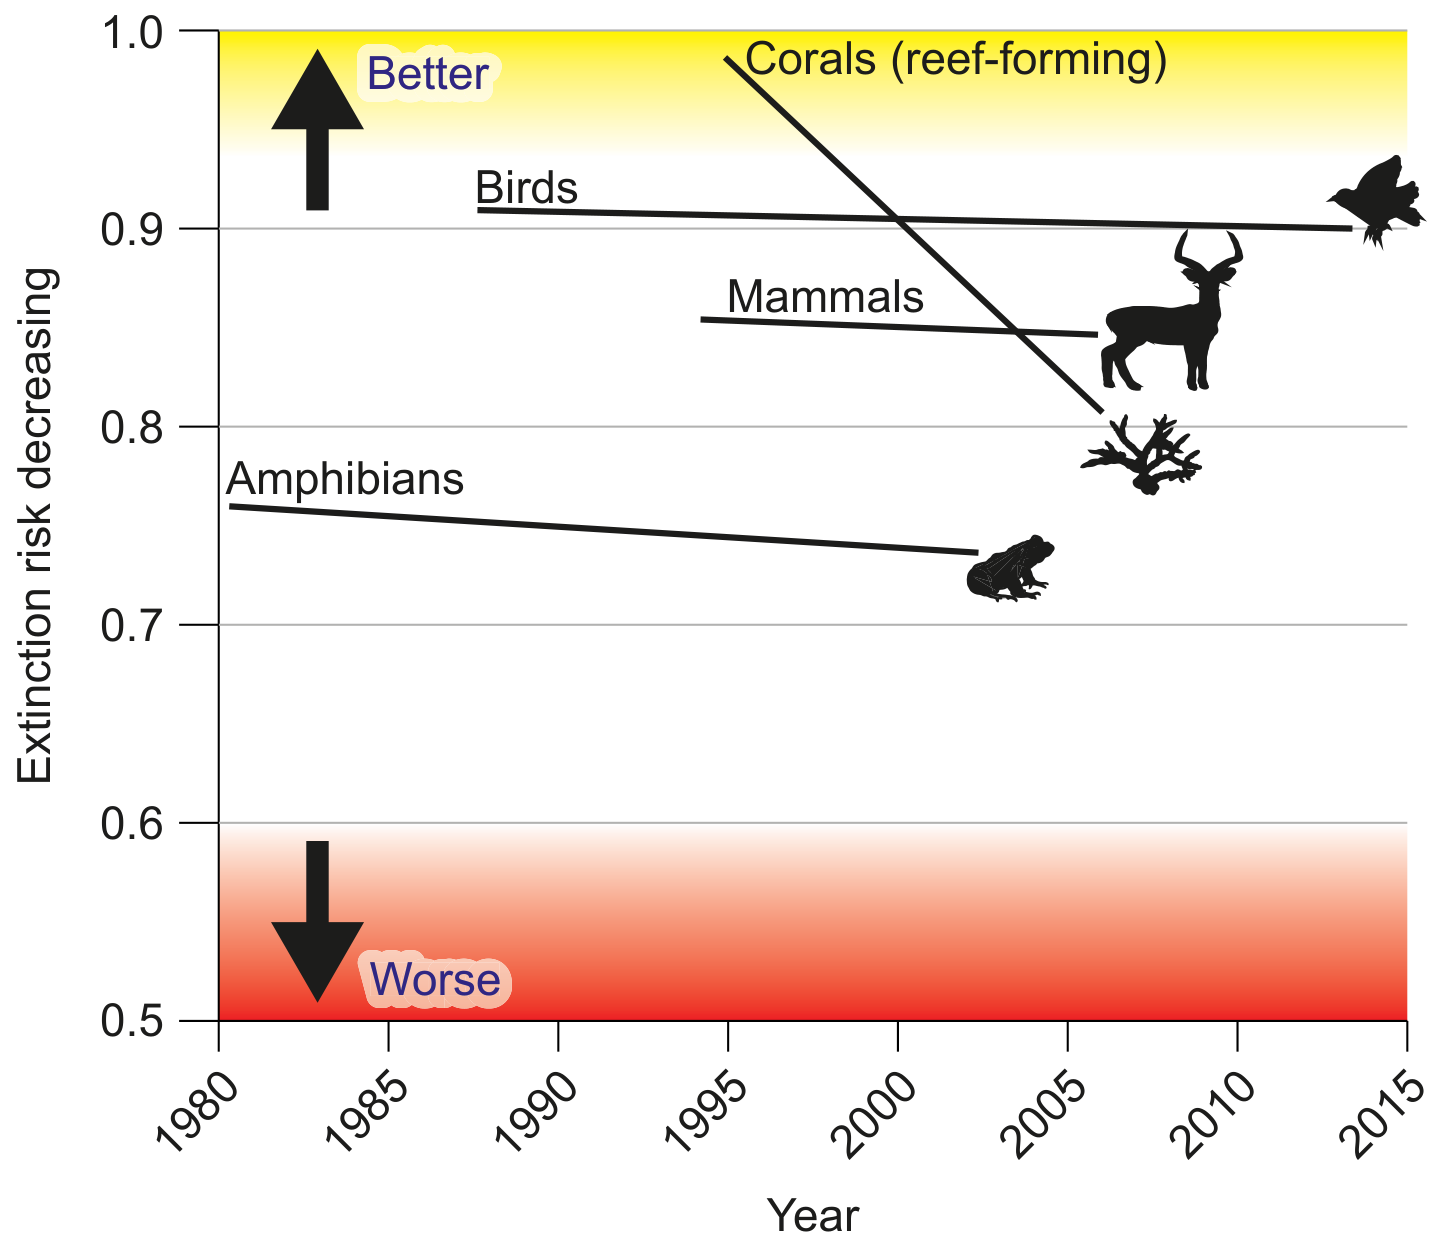
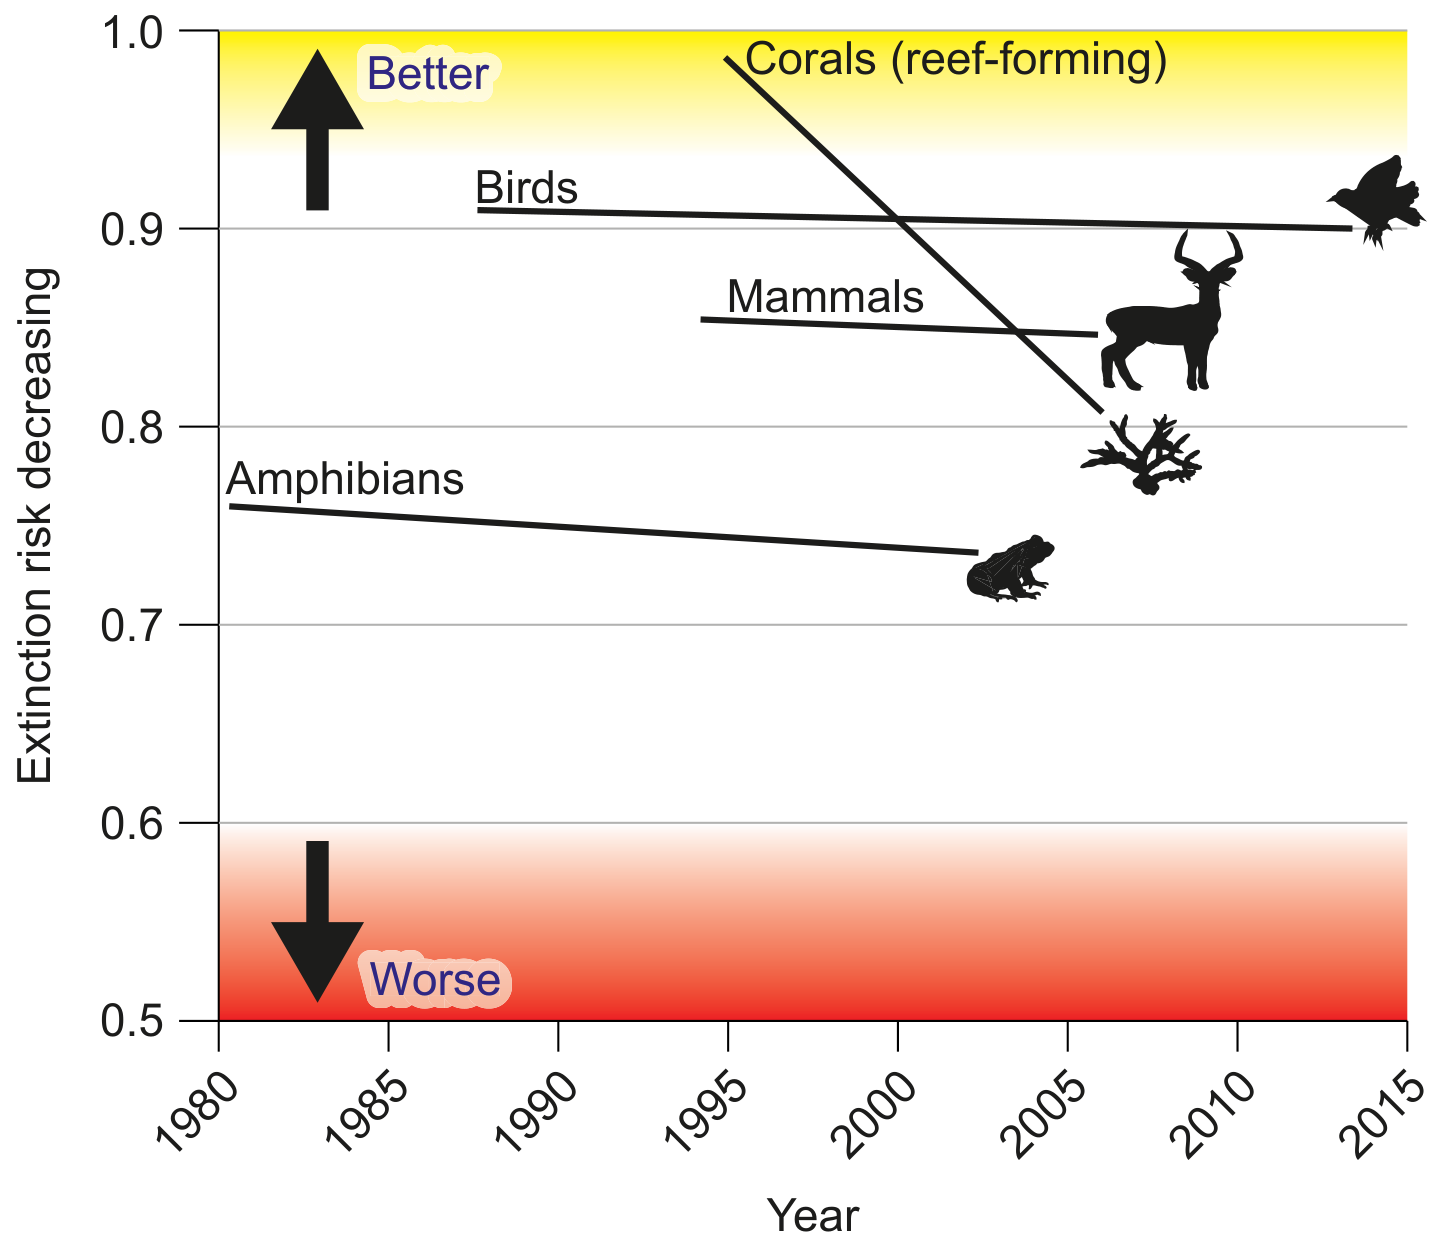
Figure 1(b): Changing species extinction risk by category 1980-2015
Question 1(a)
(a)
State the category with the highest percentage of vulnerable species in Figure 1(a).
[ 1 ]
Question 1(b)
(b)
Outline two reasons why Amphibians have the highest percentage of critically endangered species in Figure 1(a).
[ 2 ]
Question 1(c)
(c)
Using Figure 1(a), state the approximate percentage of threatened crustaceans.
[ 1 ]
Question 1(d)
(d)
Describe one reason for the lack of available data for crustaceans.
[ 1 ]
Question 1(e)
(e)
Outline three reasons why the trend for corals is different to the other categories shown in Figure 1(b).
[ 3 ]