EduNinja

IB ESS SL2.5 Zonation, succession and changeQuestion Bank

Question 1

Question 1(b)

(a)
Figure 5(a): Salinity variation in the Large Ocean Management Area

Figure 5(a): Salinity variation in the Large Ocean Management Area

Figure 5(b): Water-surface temperature variation across the LOMA

Figure 5(b): Water-surface temperature variation across the LOMA

Figure 5(b) key: temperature scale

Figure 5(b) key: temperature scale

Suggest one reason for the zonation seen in Figure 5(b).

[ 1 ]

Question 1

[Maximum number: 1]

Figure 1 shows how vegetation changes with altitude in the Andean mountain chain in South America.

Figure 1

Figure 1

Question 1(a)

(a)

State the term for the pattern of vegetation shown in Figure 1.

[ 1 ]

Question 1

Question 1(c)

Question 1(c)(i)

(a)
(i)

With reference to Figure 6, identify two changes in land use that have taken place in the Copperbelt Province between 1972 and 2000.

Figure 6: Copperbelt land use in 1972

Figure 6: Copperbelt land use in 1972

Figure 6: Copperbelt land use in 2000

Figure 6: Copperbelt land use in 2000

Figure 6 land use changed from 1972 to 2000: agriculture/scattered dwellings/mixed vegetation increased from 40% to 59%; woodlands decreased from 56% to 32%; plantations increased from 0% to 4%.

[ 2 ]

Question 1

[Maximum number: 1]
Figure 2(a): Fact file on London

Figure 2(a): Fact file on London

Figure 9: Annual mean oxides of nitrogen ( \(\mathrm{NO

Figure 9: Annual mean oxides of nitrogen ( \(\mathrm{NO

Question 1(c)

(a)
Figure 4(a): Green spaces in London

Figure 4(a): Green spaces in London

Identify one distribution pattern of green spaces seen in Figure 4(a).

[ 1 ]

Question 1

[Maximum number: 3]
Figure 1: Stages of succession following disturbance by fire

Figure 1: Stages of succession following disturbance by fire

Question 1(b)

(a)

Outline two reasons why the climax community in Figure 1 is more stable than the intermediate community.

[ 2 ]

Question 1(c)

(b)

Distinguish between zonation and succession.

[ 1 ]

Question 2

Question 2(e)

(a)

With reference to Figures 2(a) and 2(b), suggest two reasons why the red-necked amazon population has recovered more quickly than the imperial amazon population following Hurricane David in 1979.

[ 2 ]

Question 2

Question 2(b)

(a)
Figure 6(a): Population of deer in Richmond Park, 2013-2017

Figure 6(a): Population of deer in Richmond Park, 2013-2017

Figure 6(b): Number of deer removed from Richmond Park, 2013-2017

Figure 6(b): Number of deer removed from Richmond Park, 2013-2017

Figure 6(c): Fact file on Richmond Park
- Richmond Park is a national nature reserve and Special Area of Conservation.
- Approximately 630 red and fallow deer live permanently in the park.
- There are no natural predators for deer in Richmond Park.
- Deer numbers are managed to maintain a sustainable population.
- Deer meat is sold and profits are reinvested into caring for the deer.

With reference to Figures 6(a), 6(b) and 6(c), predict how the ecosystem would be affected if the deer population in Richmond Park was not managed.

[ 2 ]

Question 2

[Maximum number: 2]

An area of temperate coniferous forest was deforested and allowed to regenerate. A survey of species numbers was conducted in three successional stages. The results of the survey are summarized in Table 1.

Table 1: The number of organisms found in each successional stage for selected species

Table 1: The number of organisms found in each successional stage for selected species

Question 2(c)

(a)

Explain why the diversity changes in the different successional stages.

Figure 2: Keen's mouse was found in all three successional stages

Figure 2: Keen's mouse was found in all three successional stages

[ 2 ]

Question 5

[Maximum number: 2]

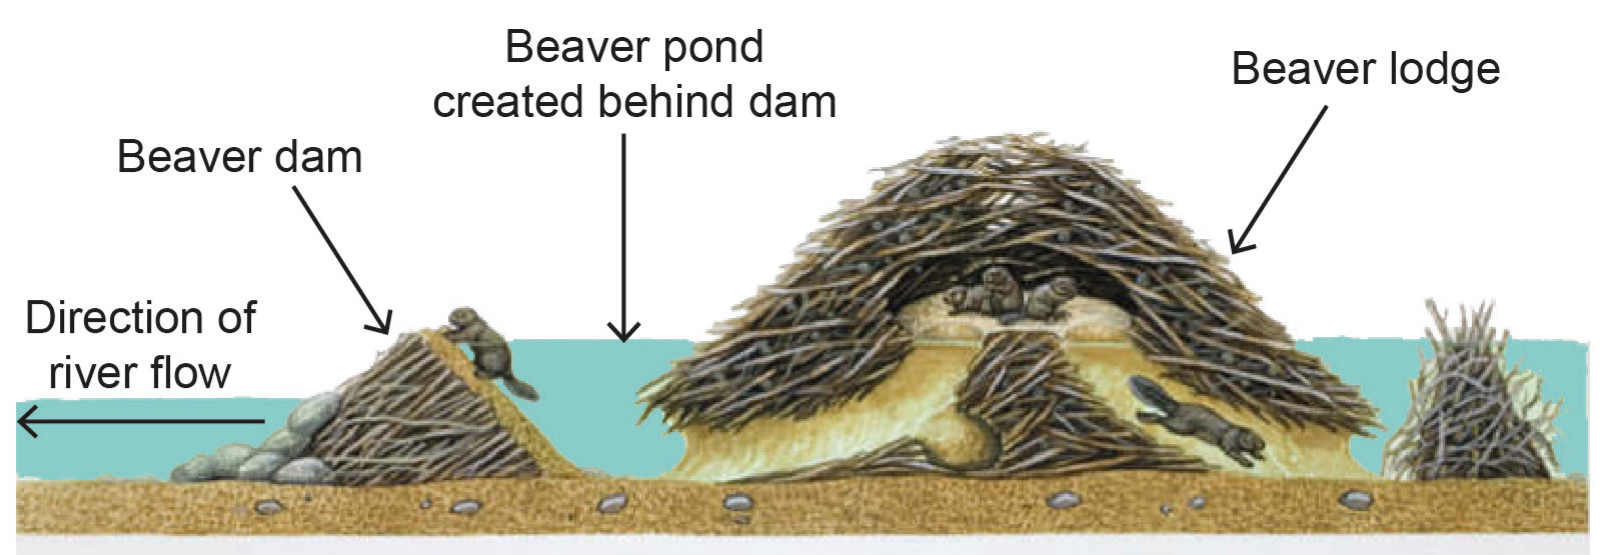
Figure 9(a): Fact file on the role of beavers in the ecosystem
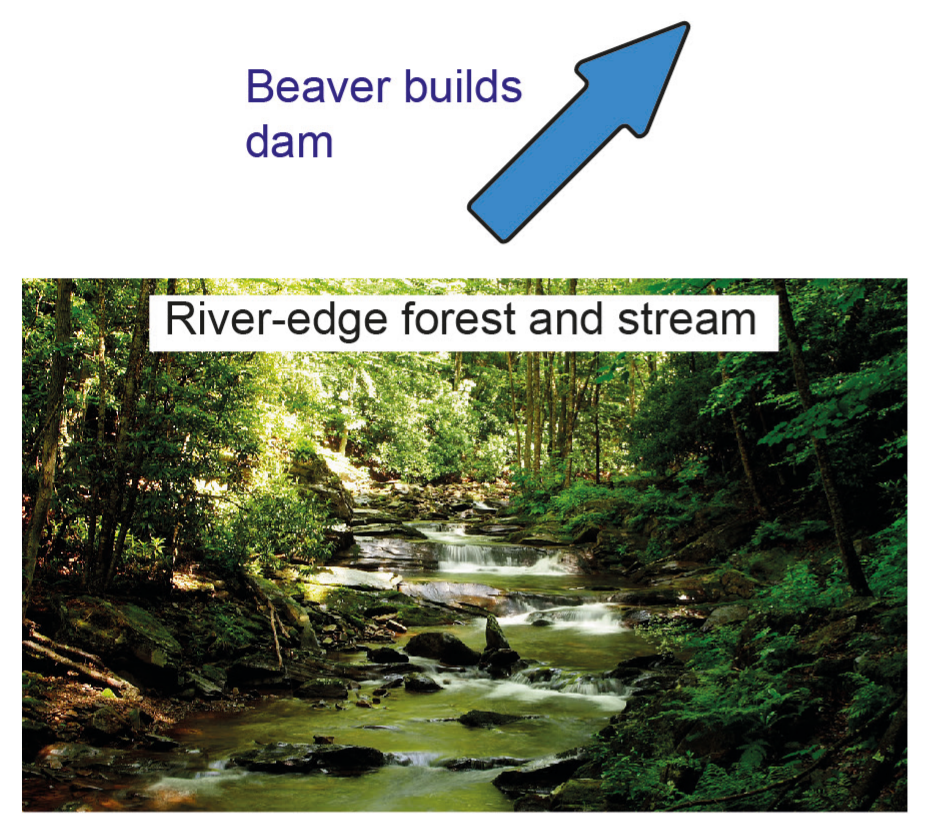
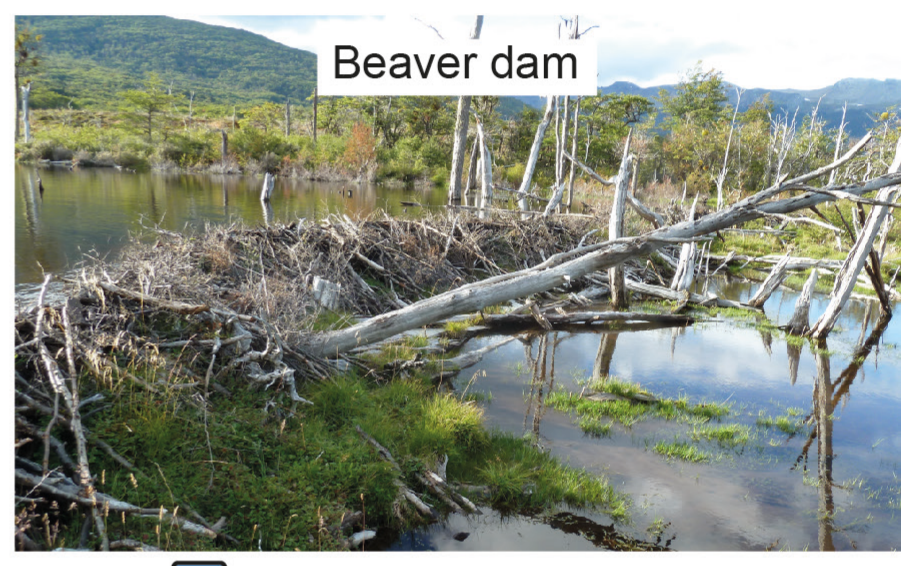
- Beavers build dams from sticks, creating ponds and slowing river flow.
- Beaver ponds provide new habitats for aquatic plants, dragonfly larvae, bullfrogs and other fish, but are less suitable for river fish such as brook trout.
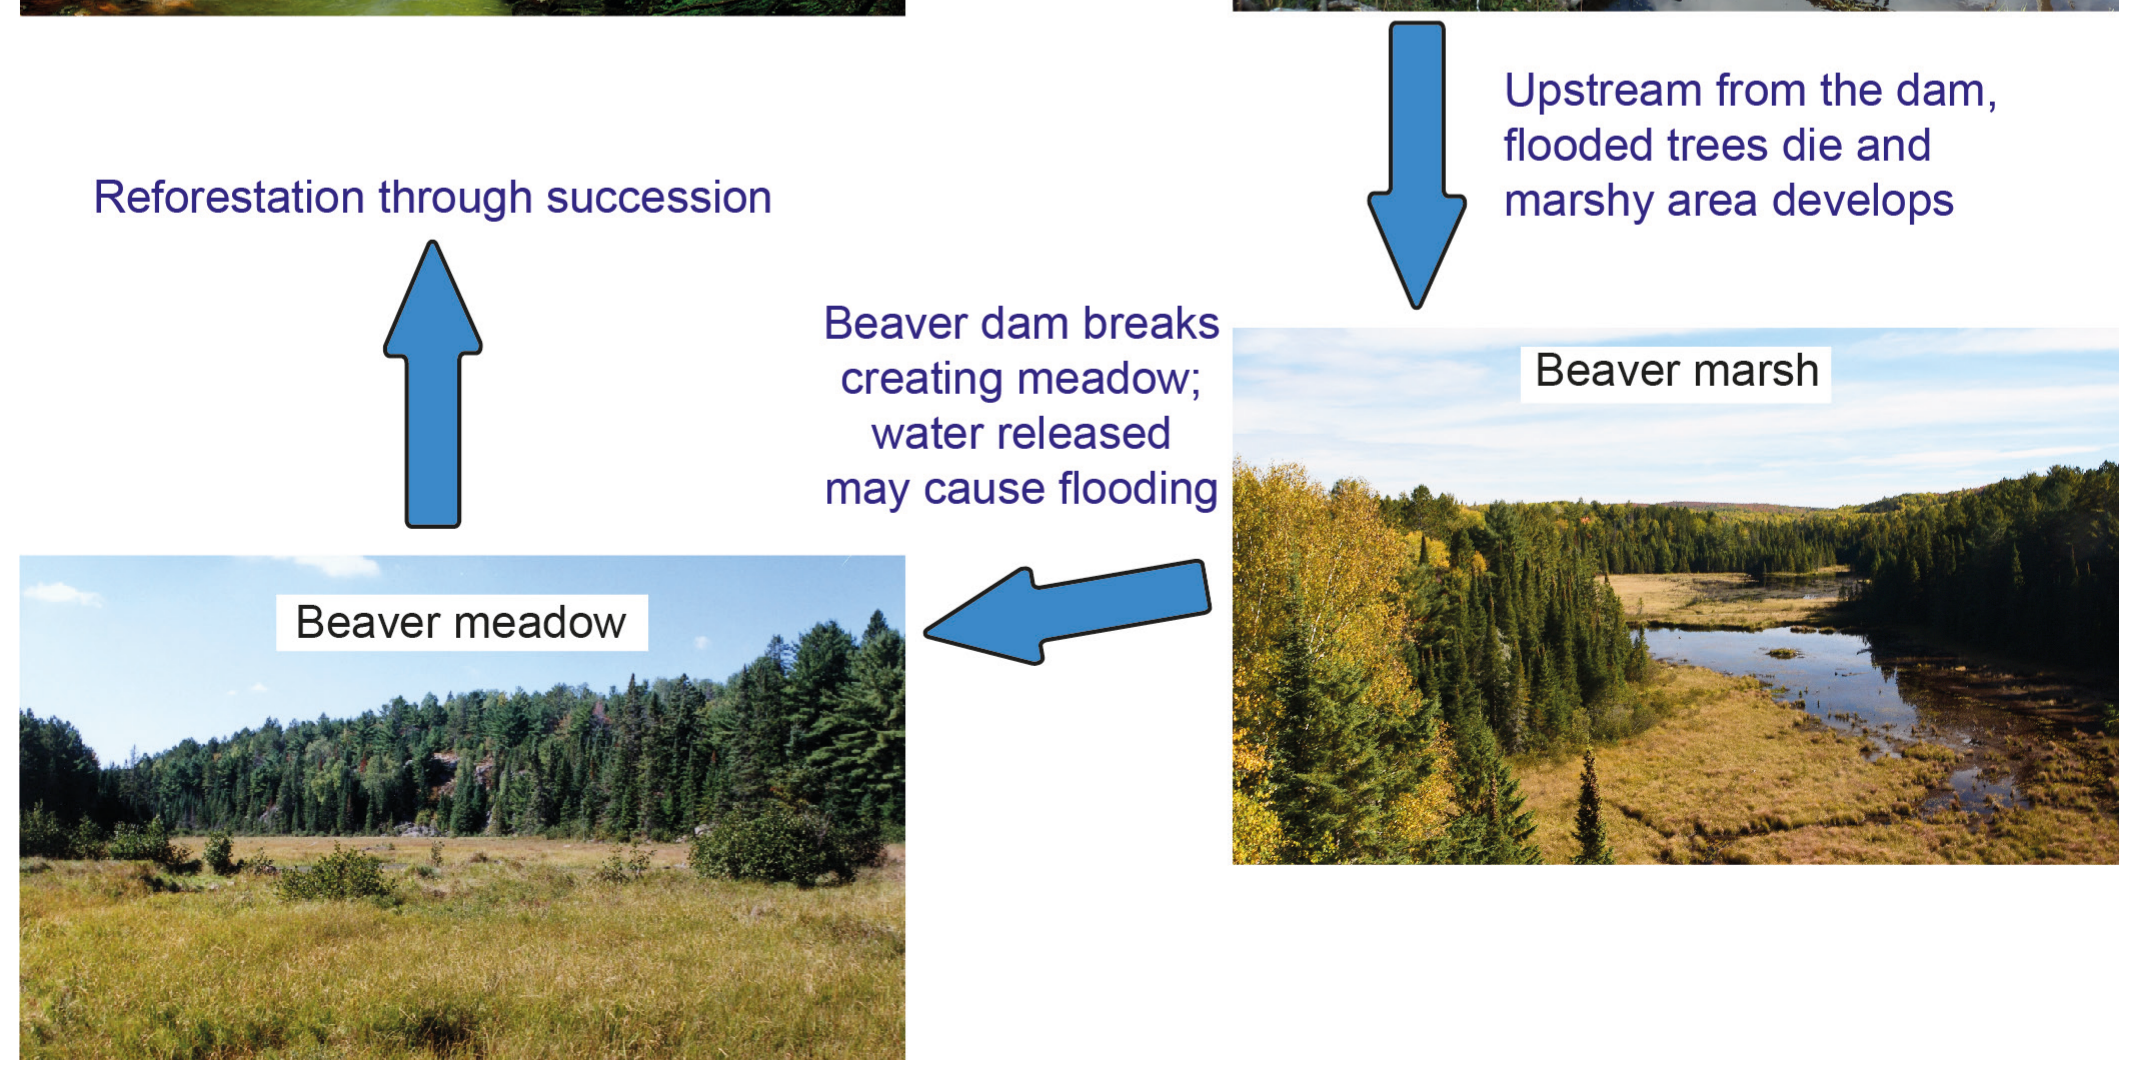
- Dams can cause flooding; flooded riverside trees may die and provide nesting sites for birds.
- Marshy areas can form at the edge of beaver ponds; grasses and sedges colonize nutrient-rich silt to form beaver meadow.
- Beaver meadows have more light, higher soil moisture, more nitrogen and different vegetation from adjacent river-edge forest.

Figure 9(b): Succession caused when a beaver dam is built across a river

Figure 9(b): Succession caused when a beaver dam is built across a river

Figure 9(b): Succession caused when a beaver dam is built across a river (continued)

Figure 9(b): Succession caused when a beaver dam is built across a river (continued)

Figure 9(b): Succession caused when a beaver dam is built across a river (continued)

Figure 9(b): Succession caused when a beaver dam is built across a river (continued)

Figure 9(b): Succession caused when a beaver dam is built across a river (continued)

Figure 9(b): Succession caused when a beaver dam is built across a river (continued)

With reference to Figures 9(a) and 9(b), describe one abiotic change and one biotic change in a beaver meadow community undergoing succession.

Question 6

[Maximum number: 3]
Figure 9(b): Succession caused when a beaver dam is built across a river

Figure 9(b): Succession caused when a beaver dam is built across a river

Figure 9(b): Succession caused when a beaver dam is built across a river (continued)

Figure 9(b): Succession caused when a beaver dam is built across a river (continued)

Figure 9(b): Succession caused when a beaver dam is built across a river (continued)

Figure 9(b): Succession caused when a beaver dam is built across a river (continued)

Figure 9(b): Succession caused when a beaver dam is built across a river (continued)

Figure 9(b): Succession caused when a beaver dam is built across a river (continued)

Suggest how an ecologist might measure the changes in one abiotic factor along a transect from a beaver marsh, through beaver meadow to the adjoining forest.

0 selected