Question 1
[Maximum number: 1]
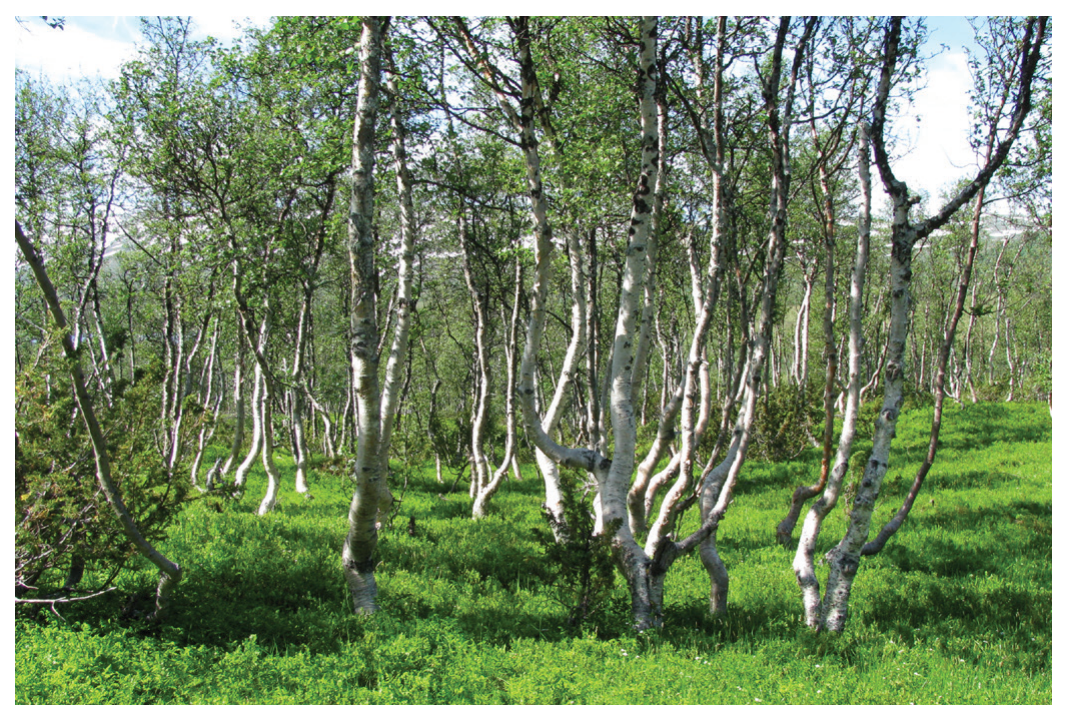
Figure 5: Native birch trees in Iceland
Question 1(a)
(a)
State one biome found in Iceland.
[ 1 ]
 EduNinja
Figure 5: Native birch trees in Iceland
State one biome found in Iceland.
Using Figure 2(b), state the annual temperature range for Sapporo.
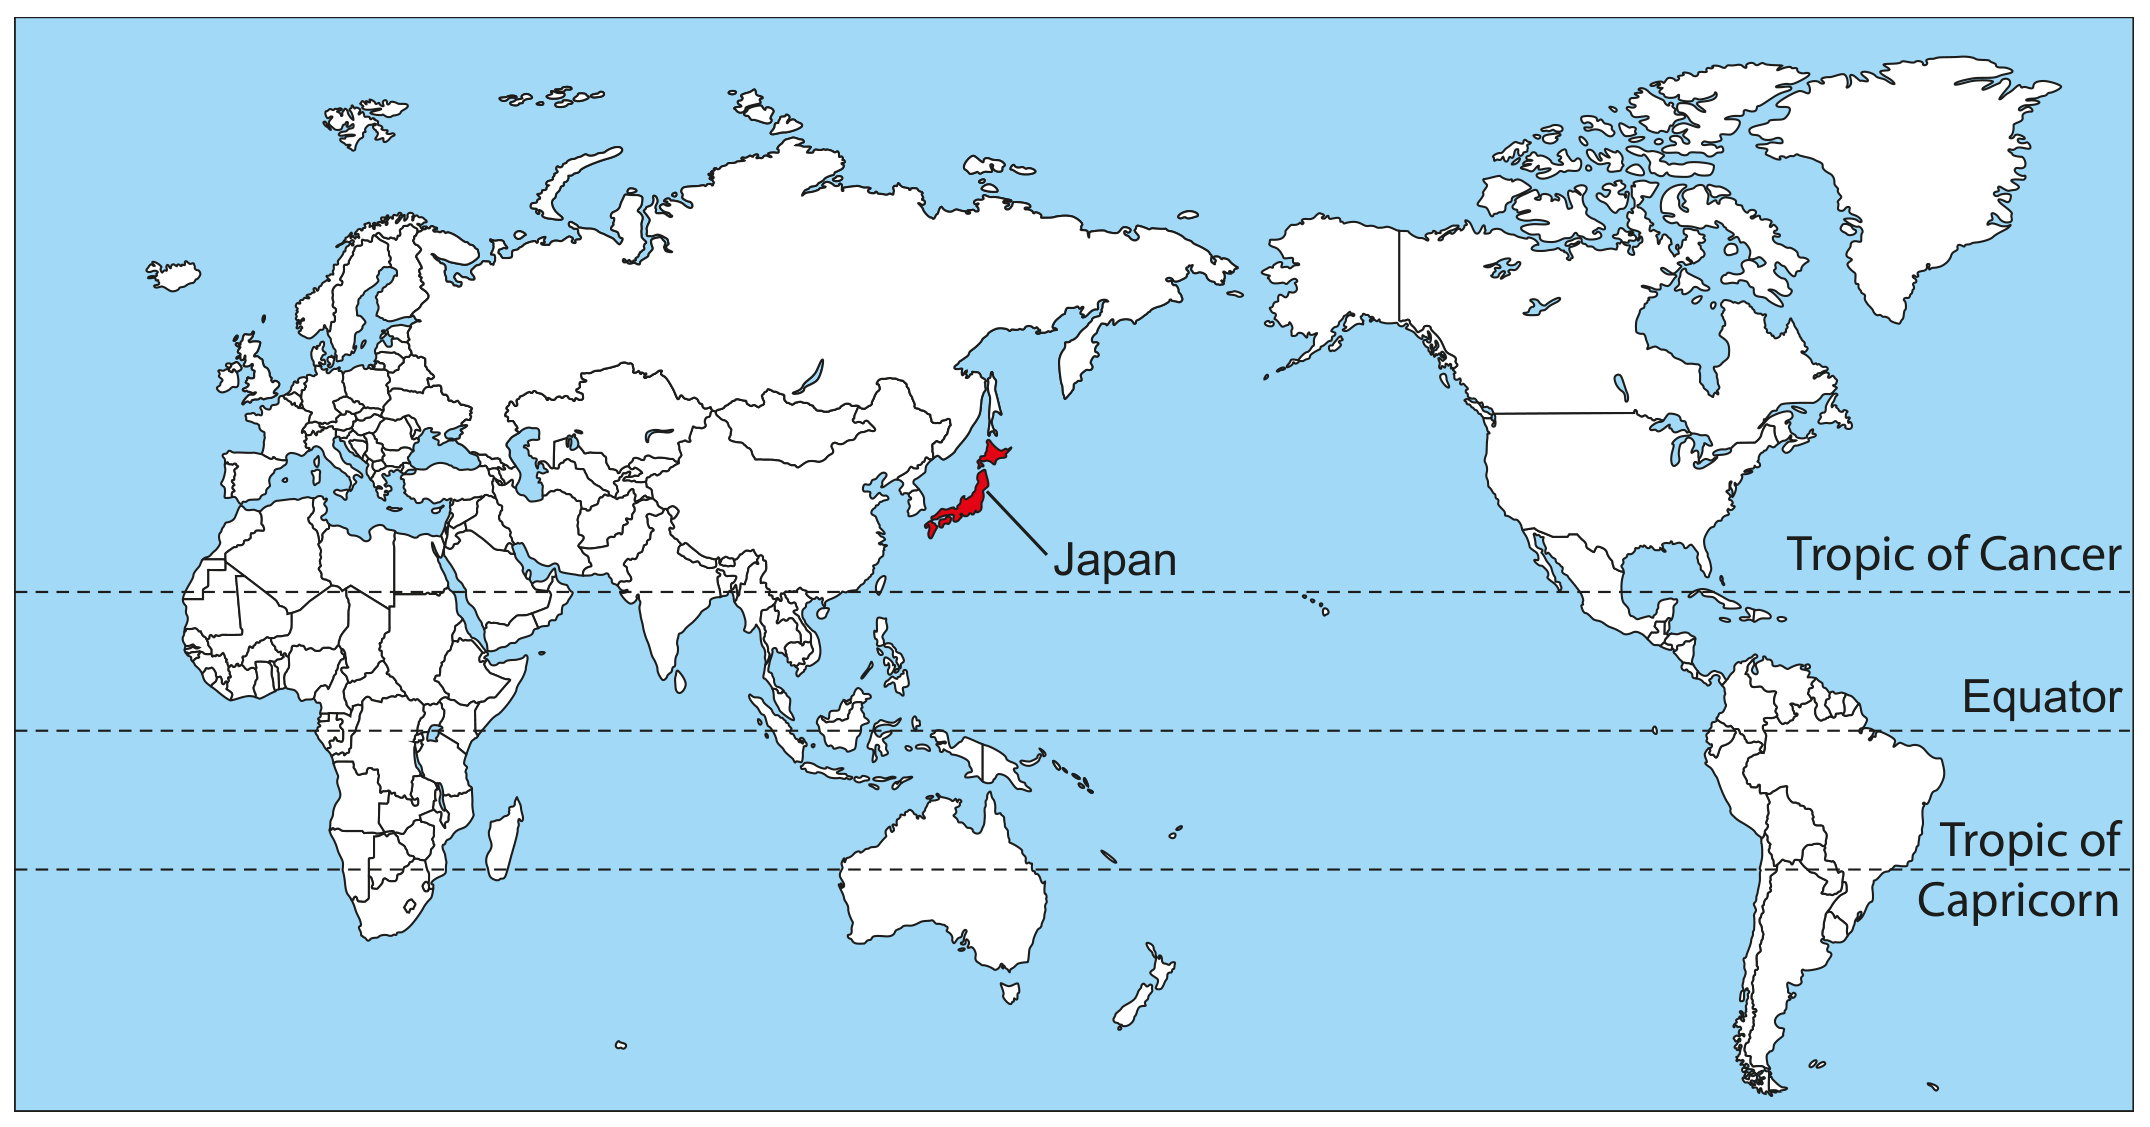
Figure 1(a): World map showing location of Japan
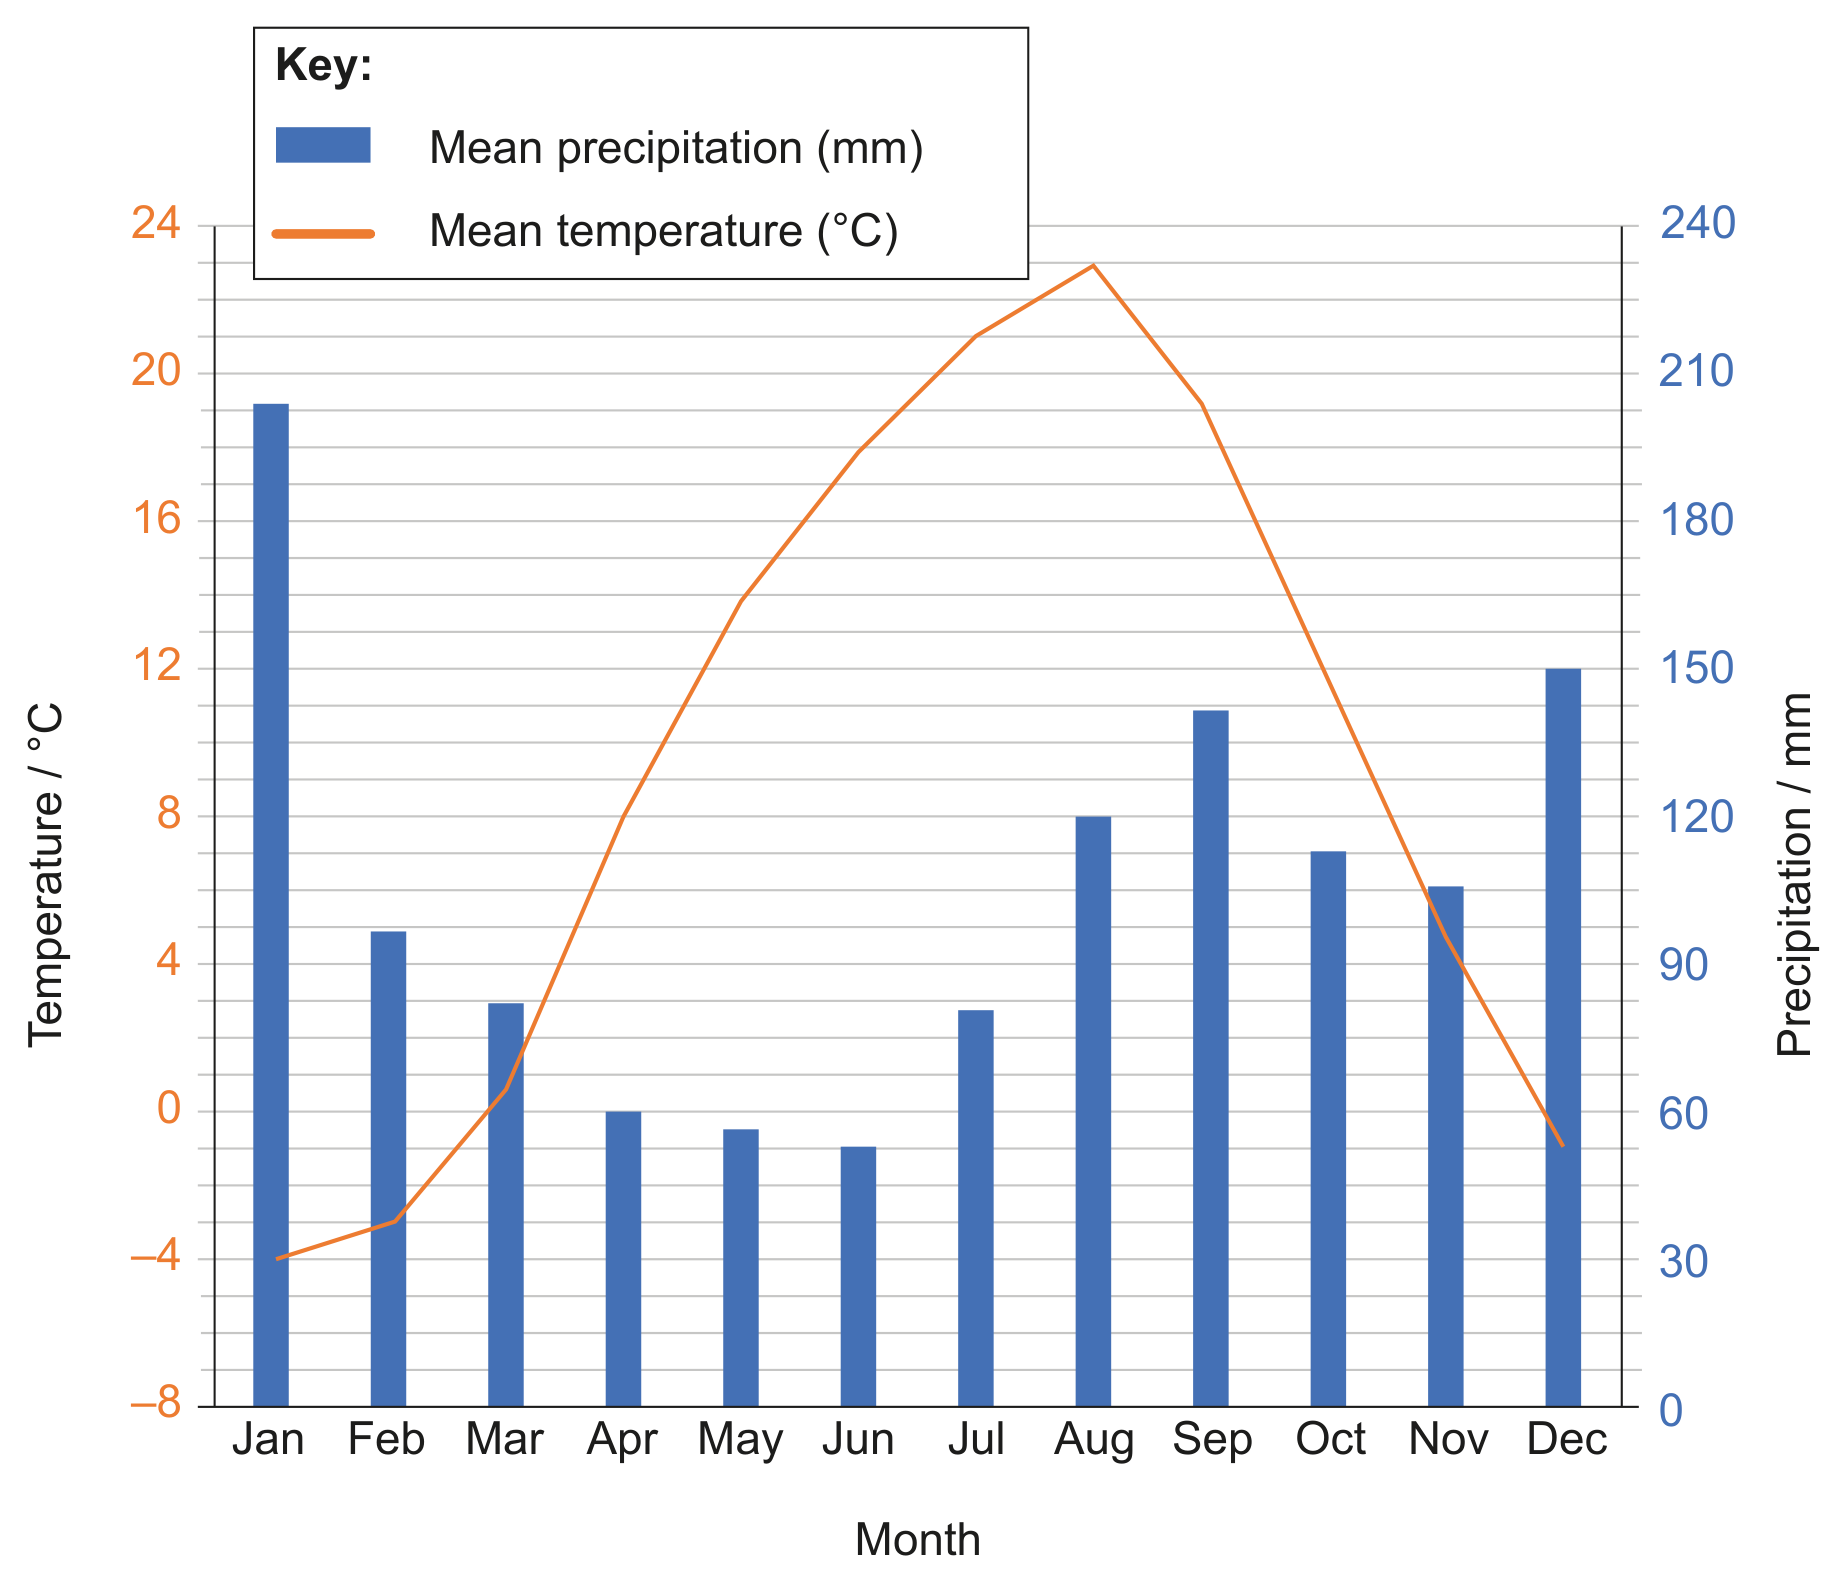
Figure 2(a): Fact file and climate graph for Hokkaido/Sapporo
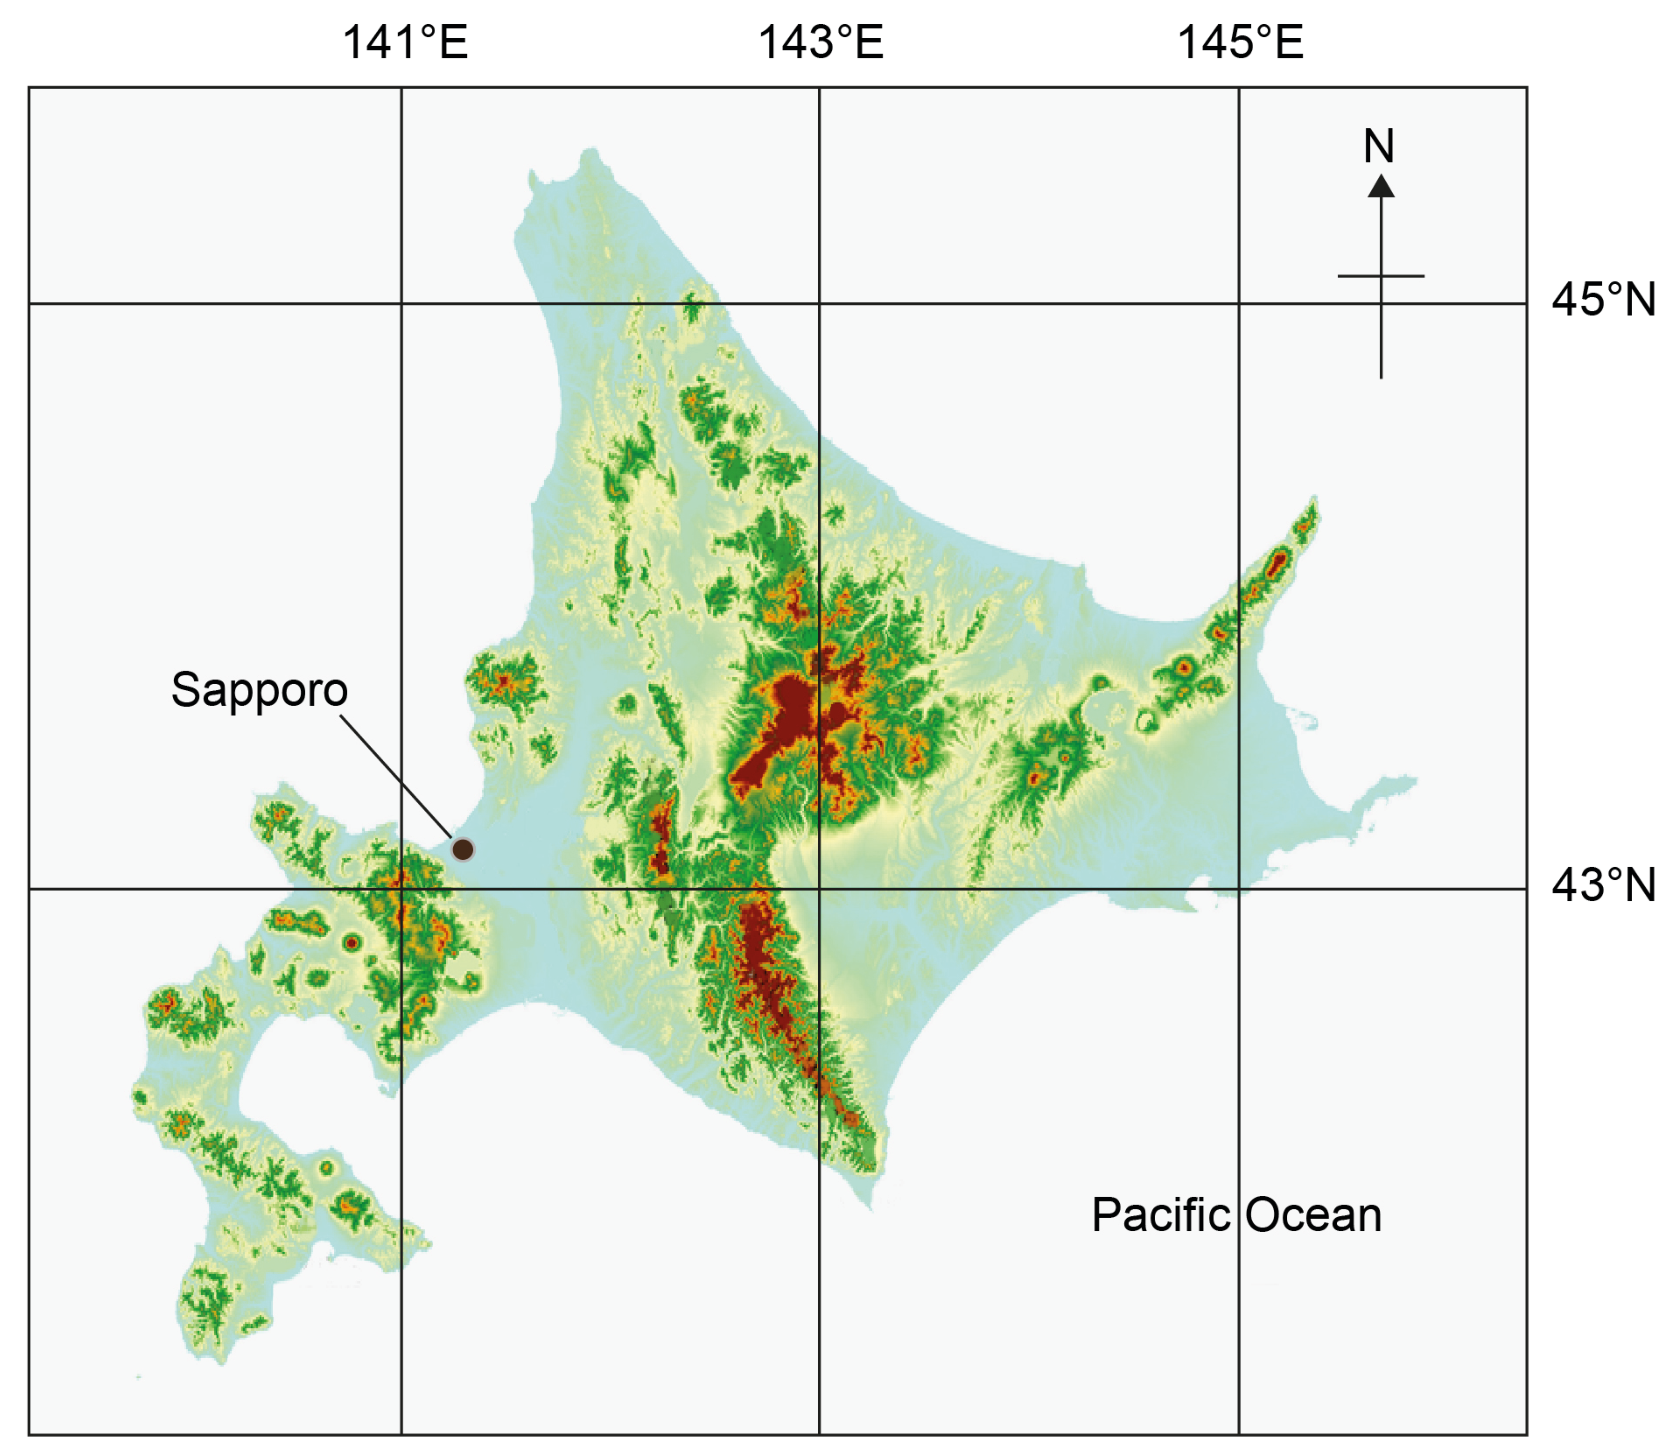
Figure 2(c): Elevation map of Hokkaido
Using Figures 1(a), 2(b) and 2(c), identify one terrestrial biome found on Hokkaido.
Figure 1 shows how vegetation changes with altitude in the Andean mountain chain in South America.
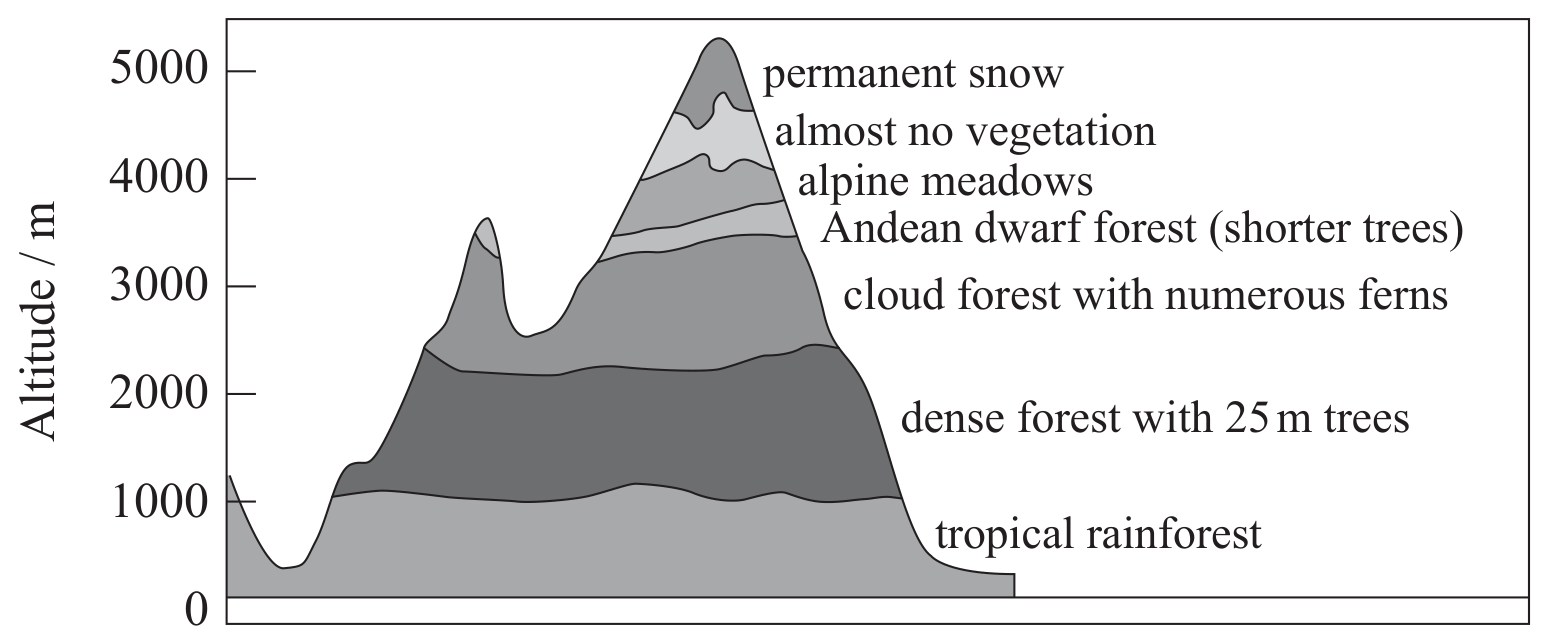
Figure 1
Identify two limiting factors affecting the vegetation in the alpine meadows.
Suggest one way in which the pattern of vegetation shown in Figure 1 might change as a result of global warming.
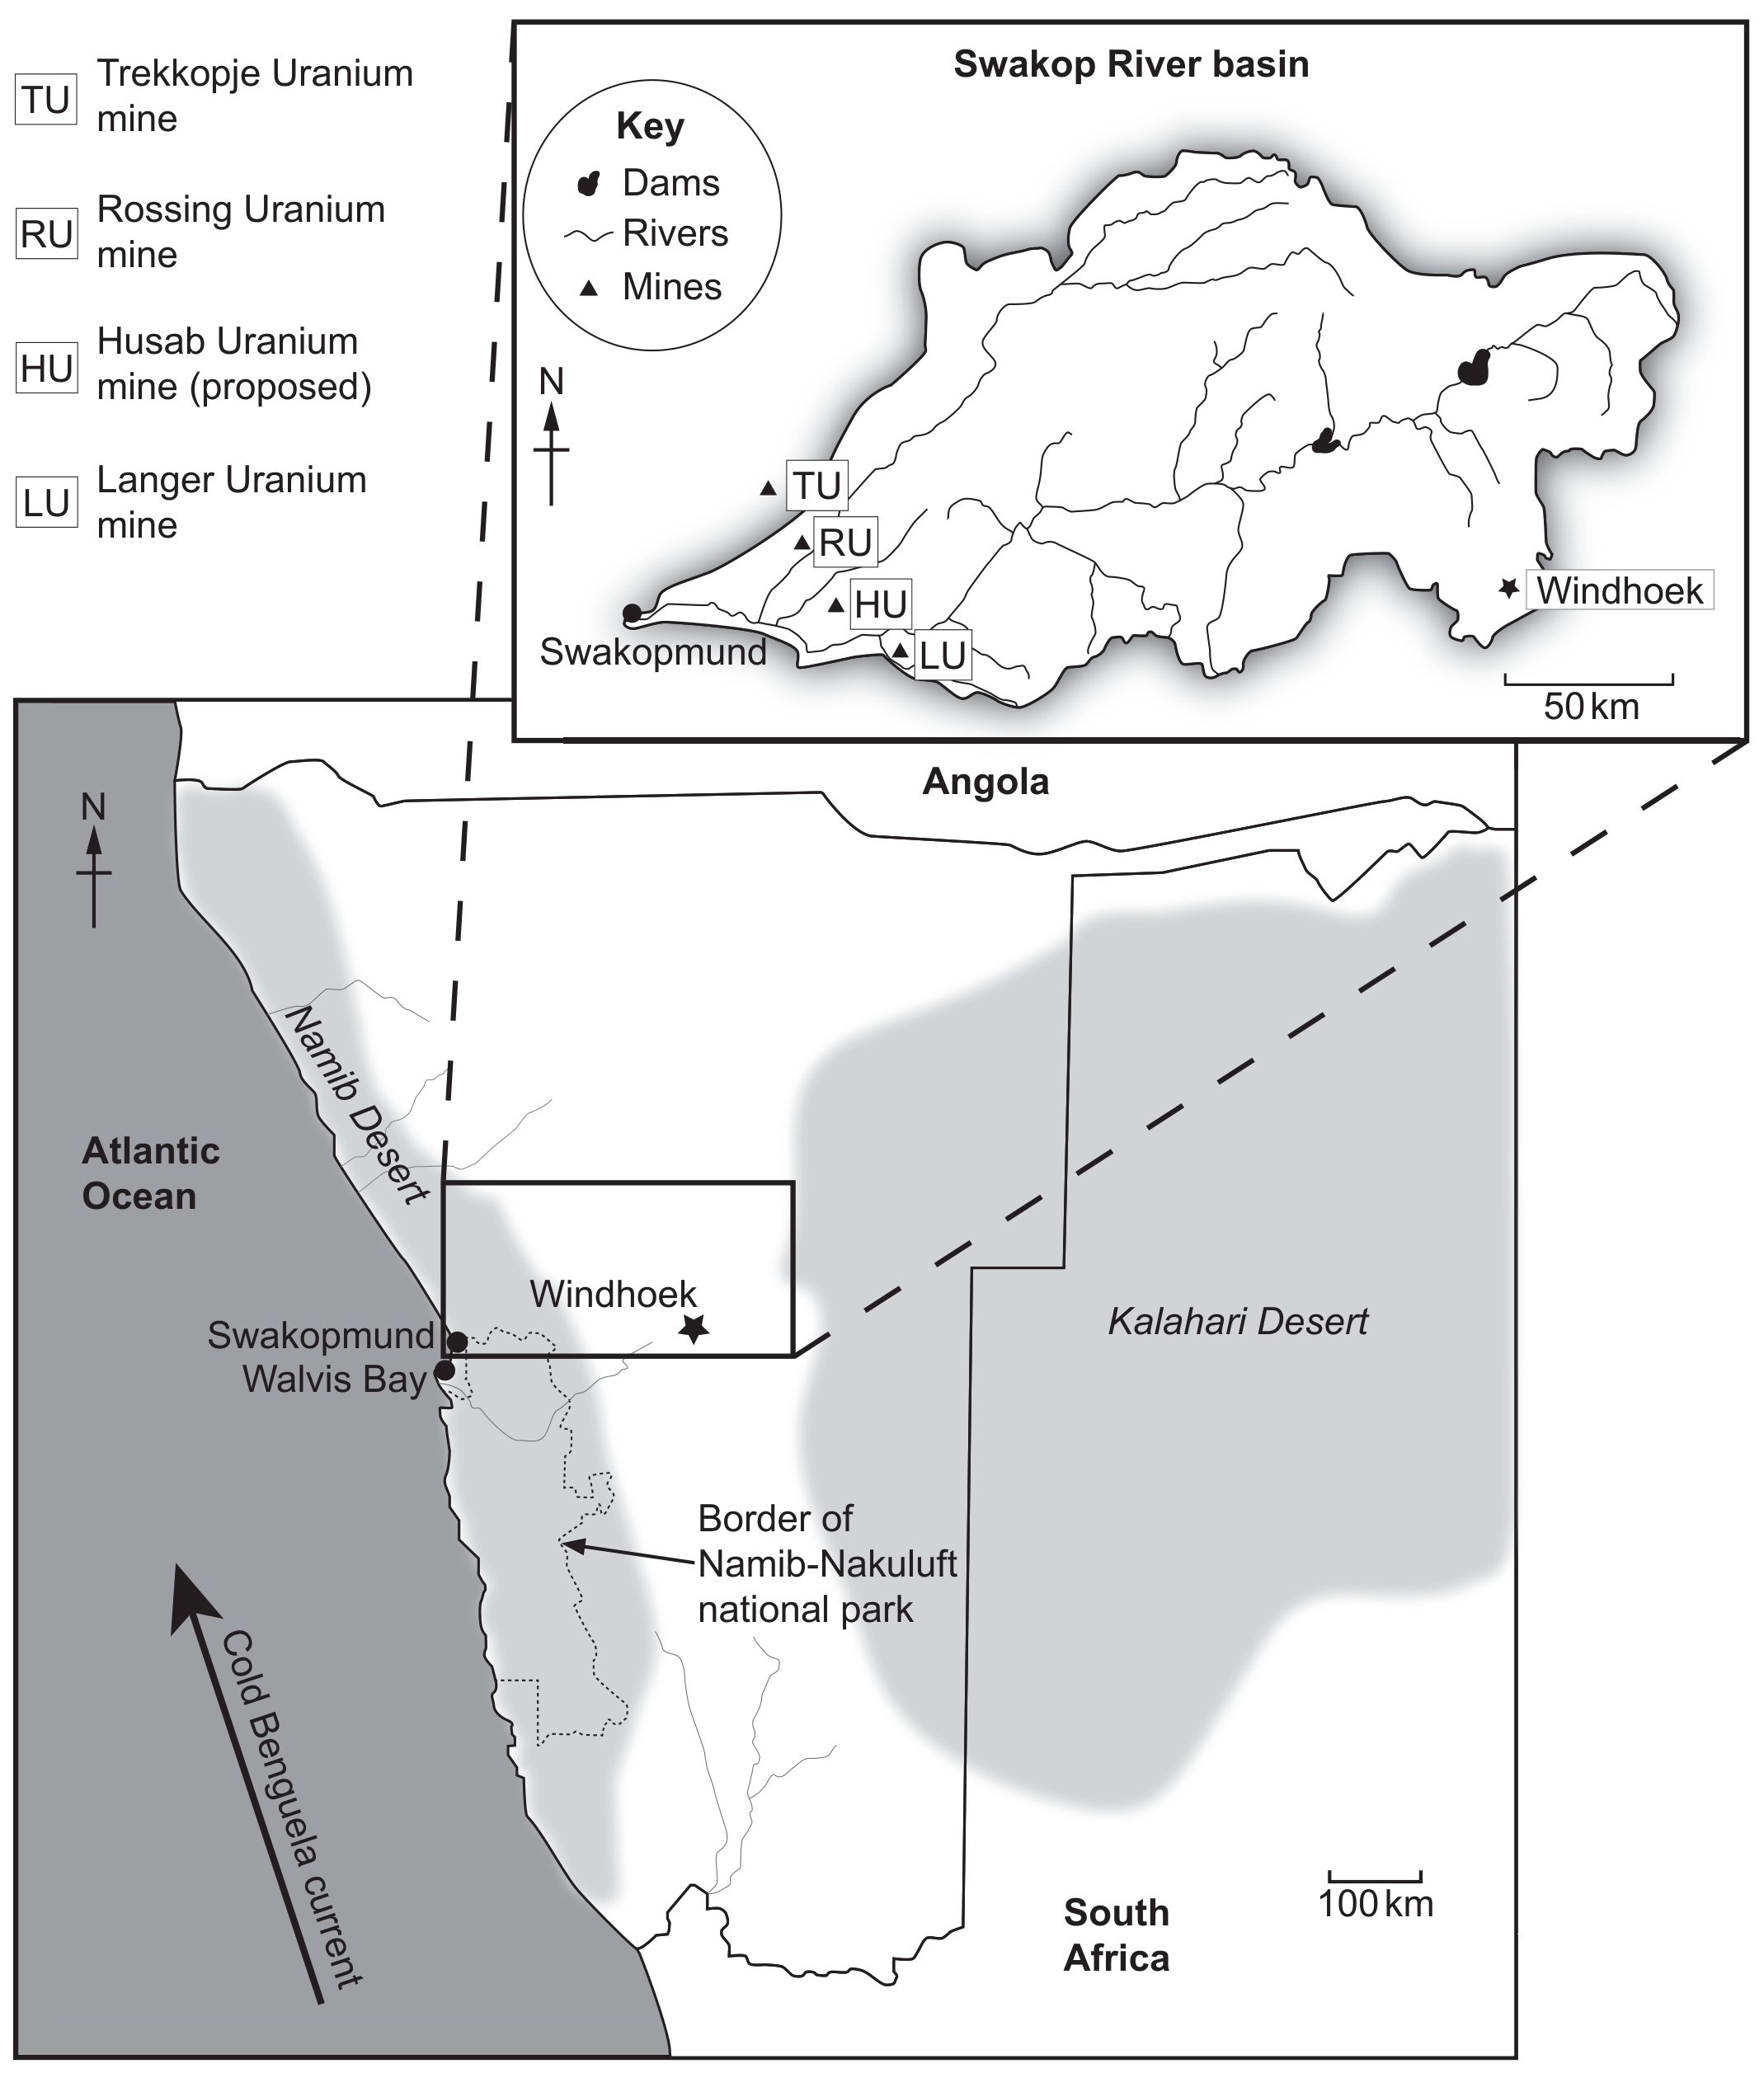
Figure 1(b): Map showing Swakop River in Namibia
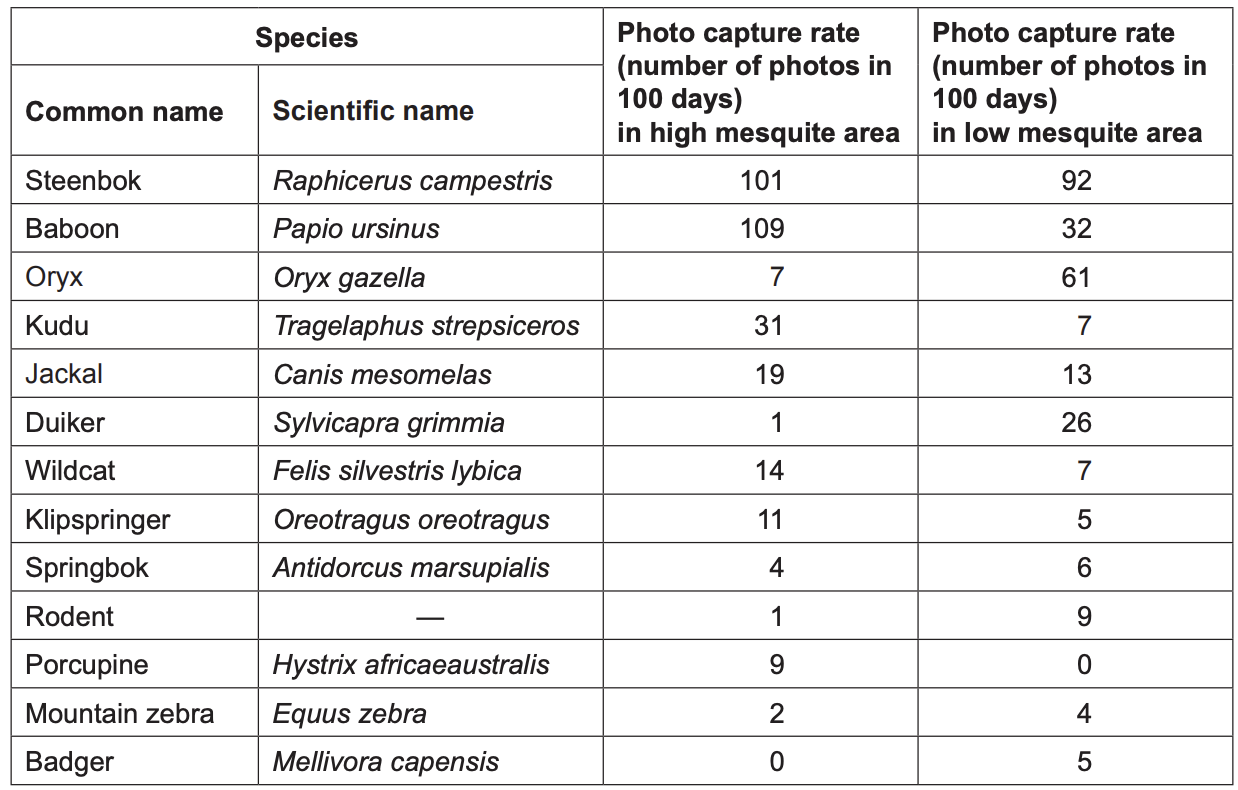
Figure 4(b): Camera trap data for high and low mesquite areas
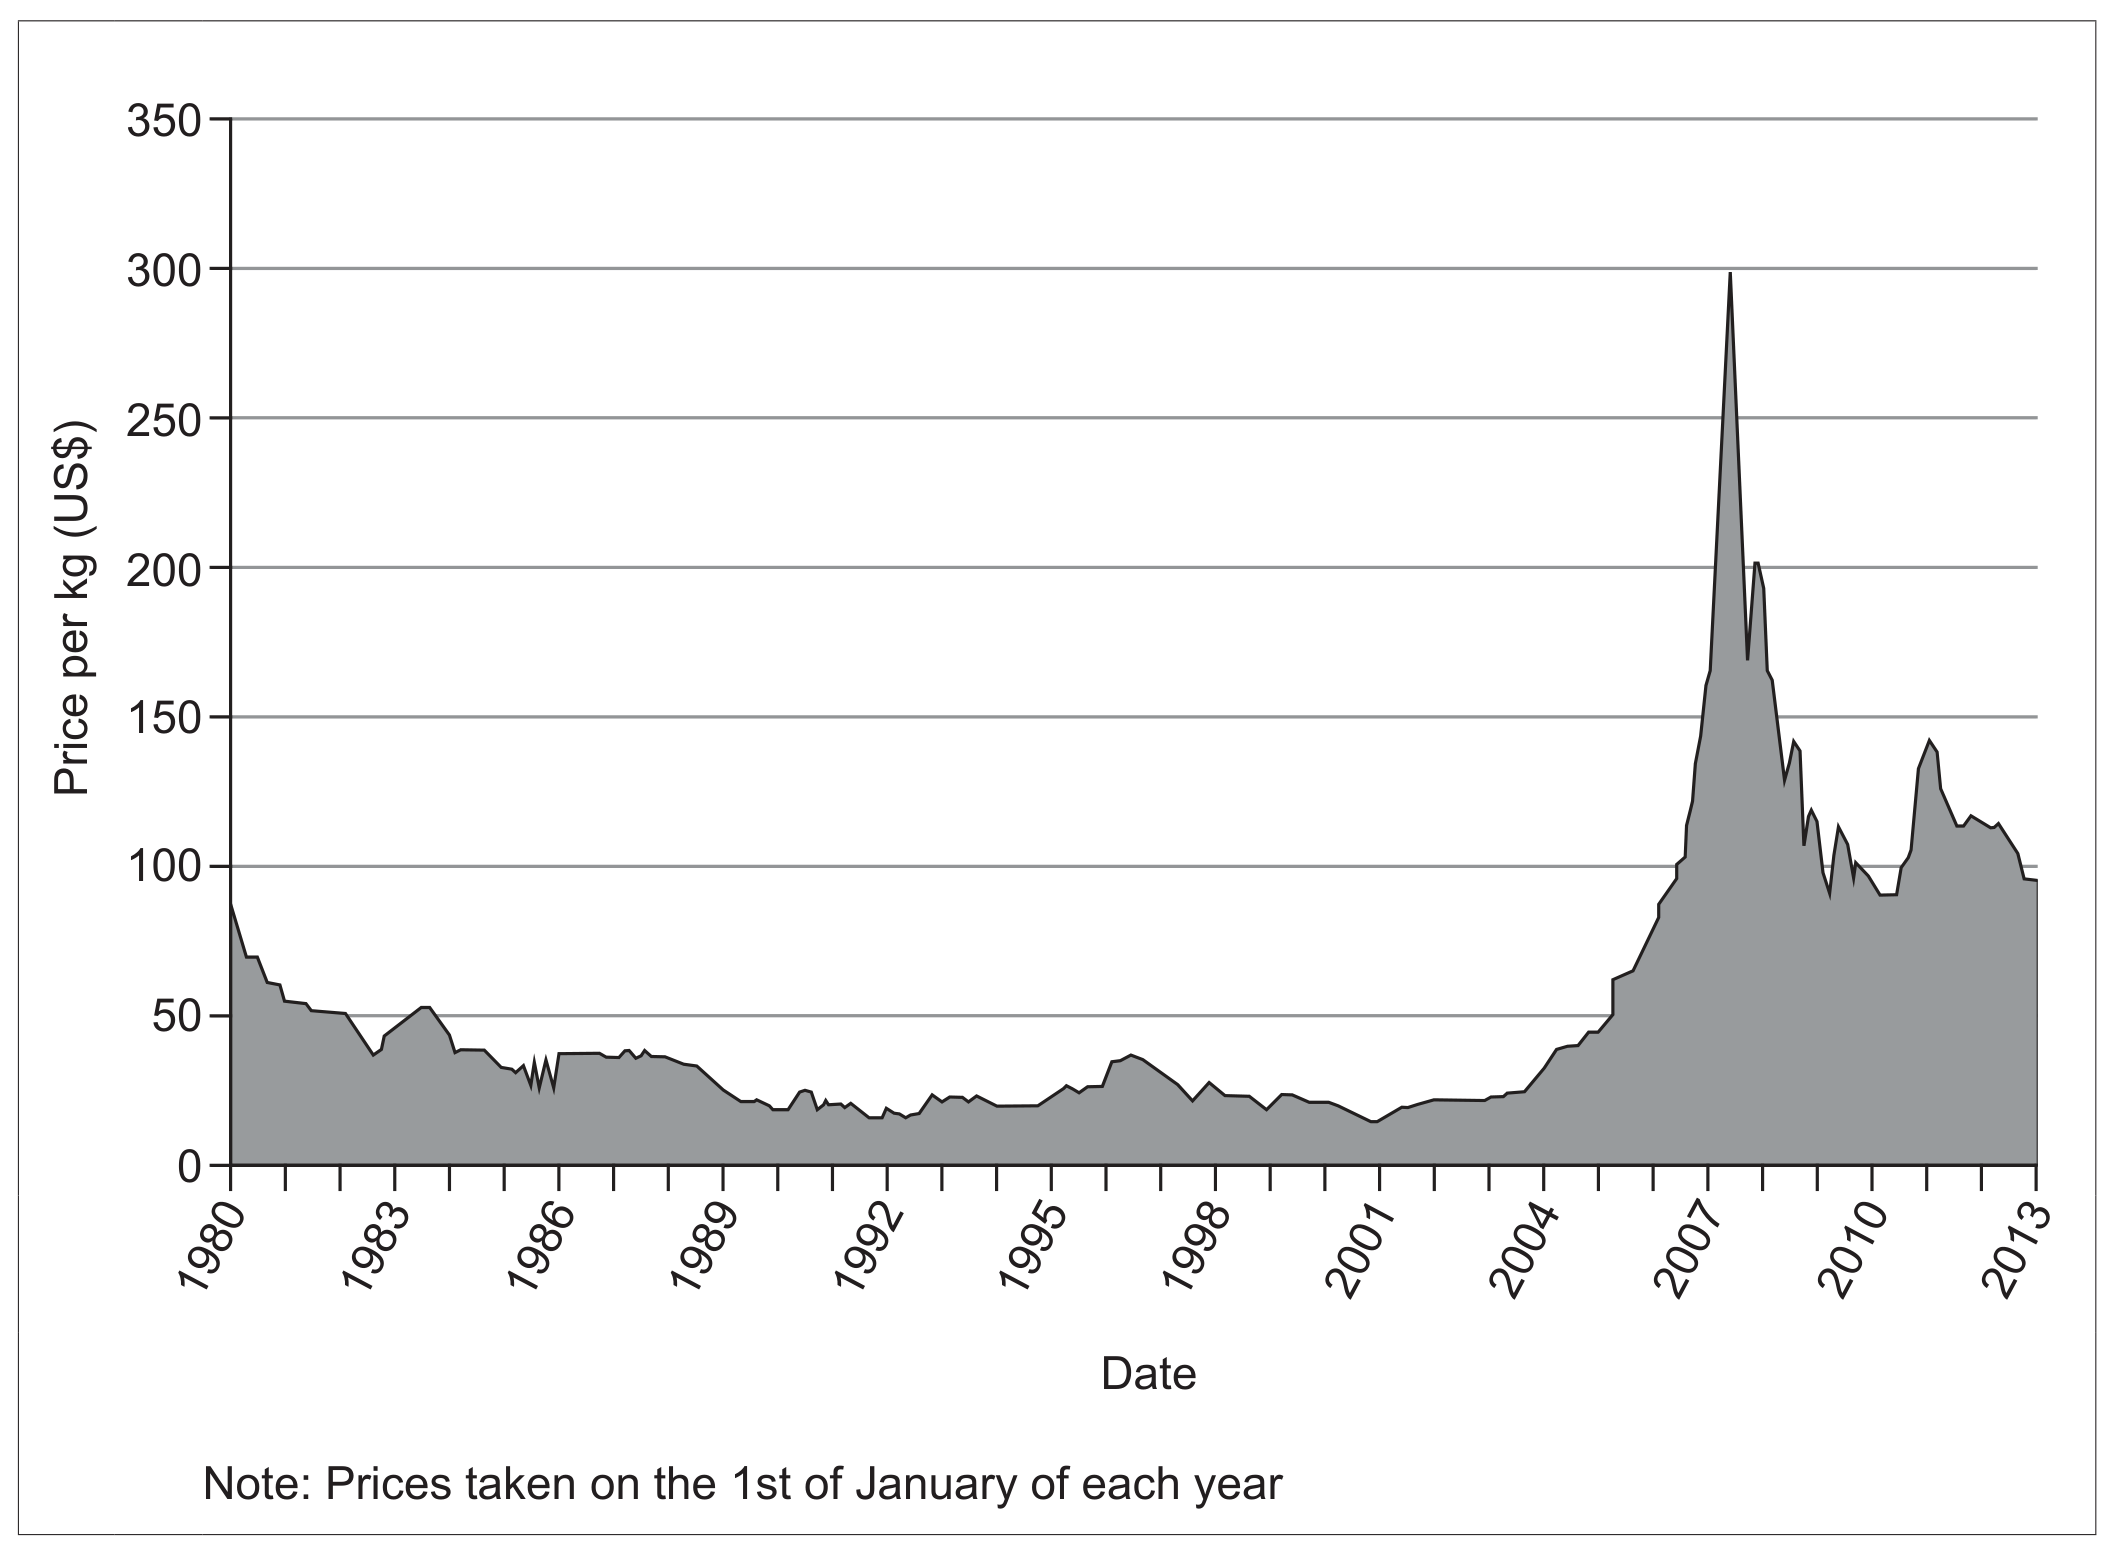
Figure 5(a): Uranium prices from 1980 to 2013
State the biome for the area shown in Figure 1(b).
Figure 1 below shows a food web for an ecosystem within a Tundra biome.
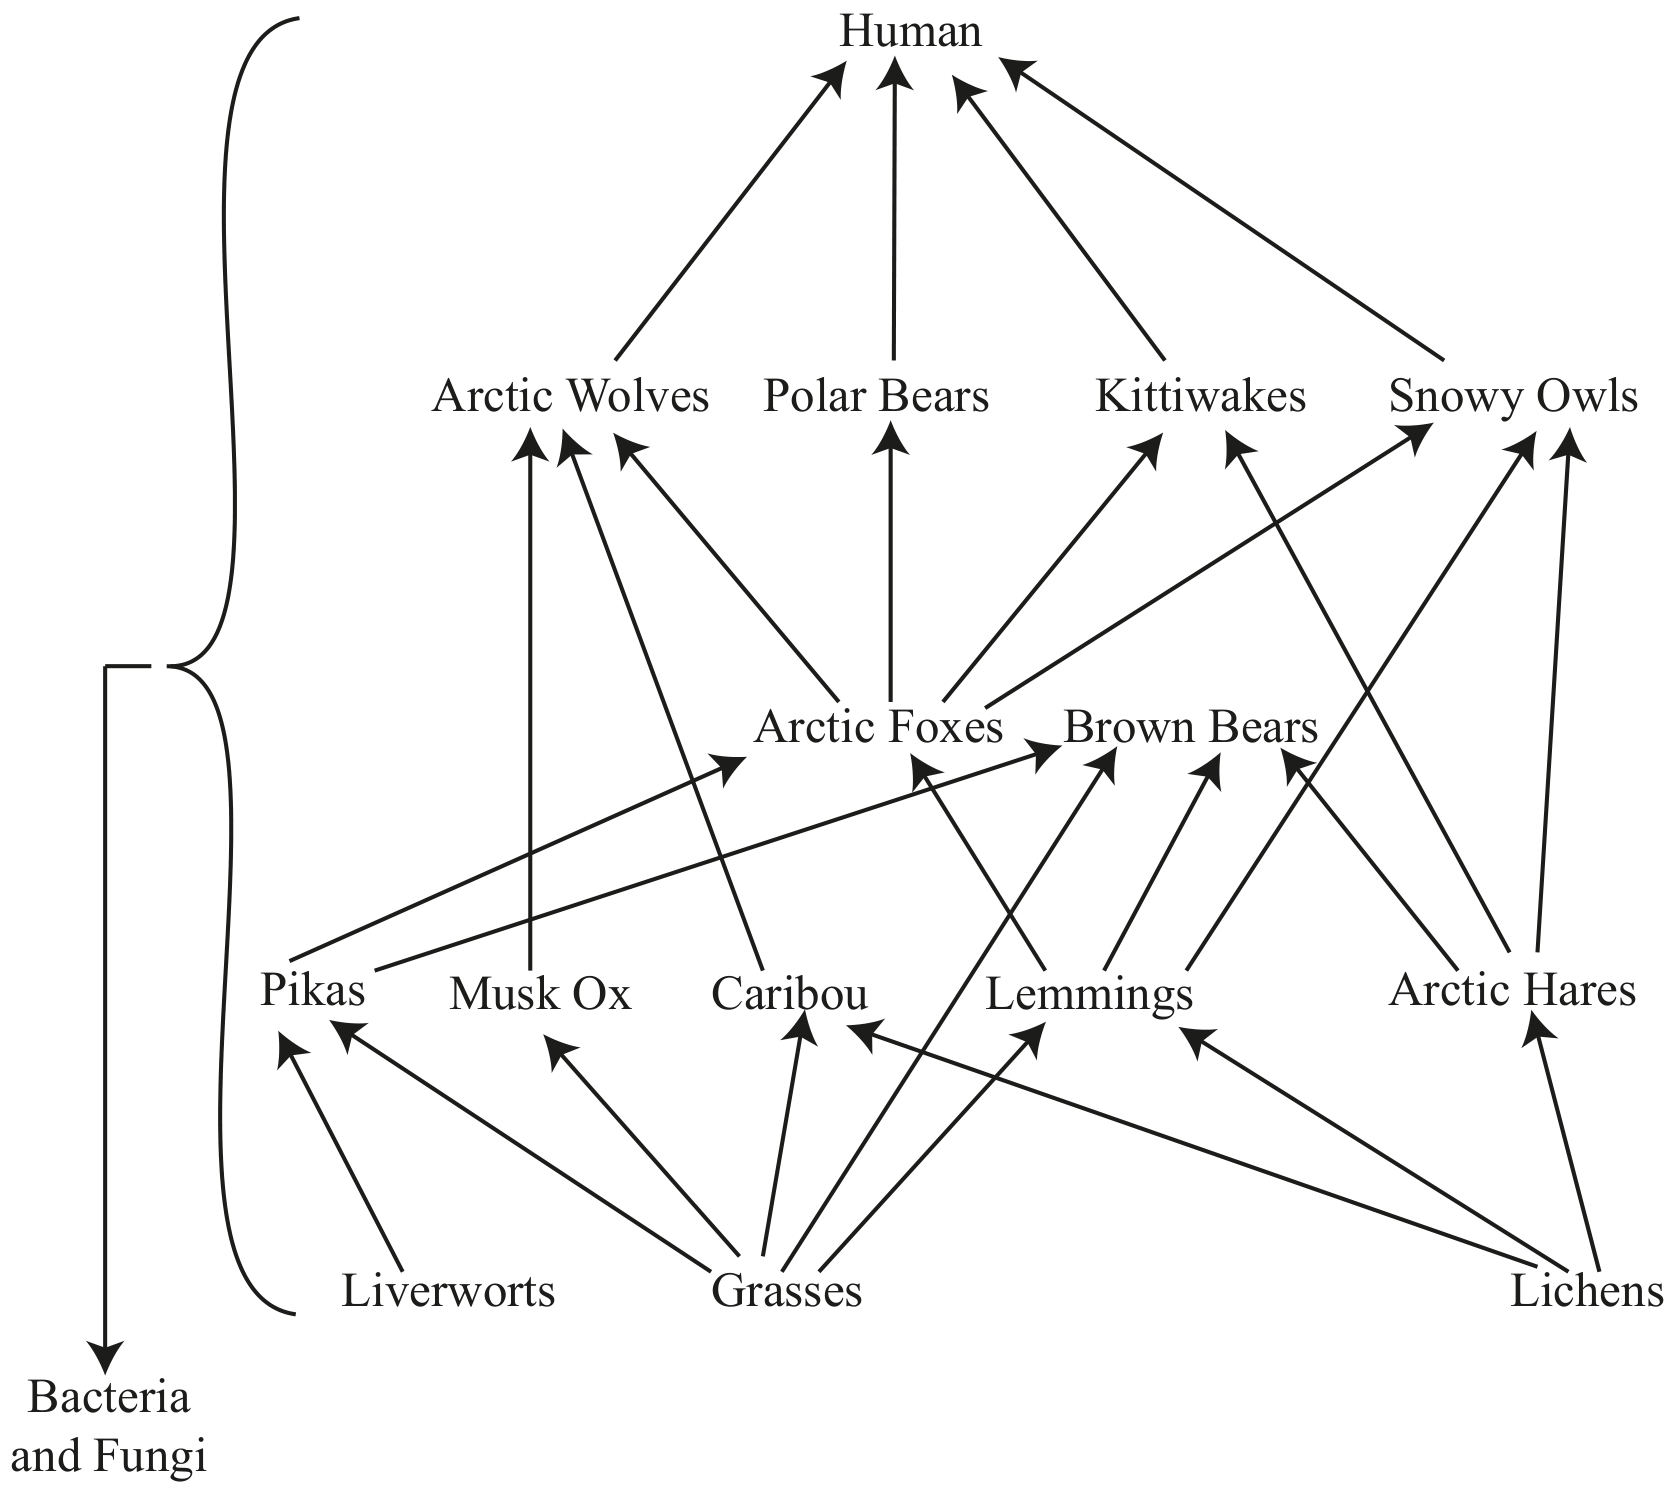
Figure 1
Define the term biome.
Identify two abiotic factors that affect the distribution of tundra.
With reference to Figure 2(a), identify the most widespread biome in Siberia.
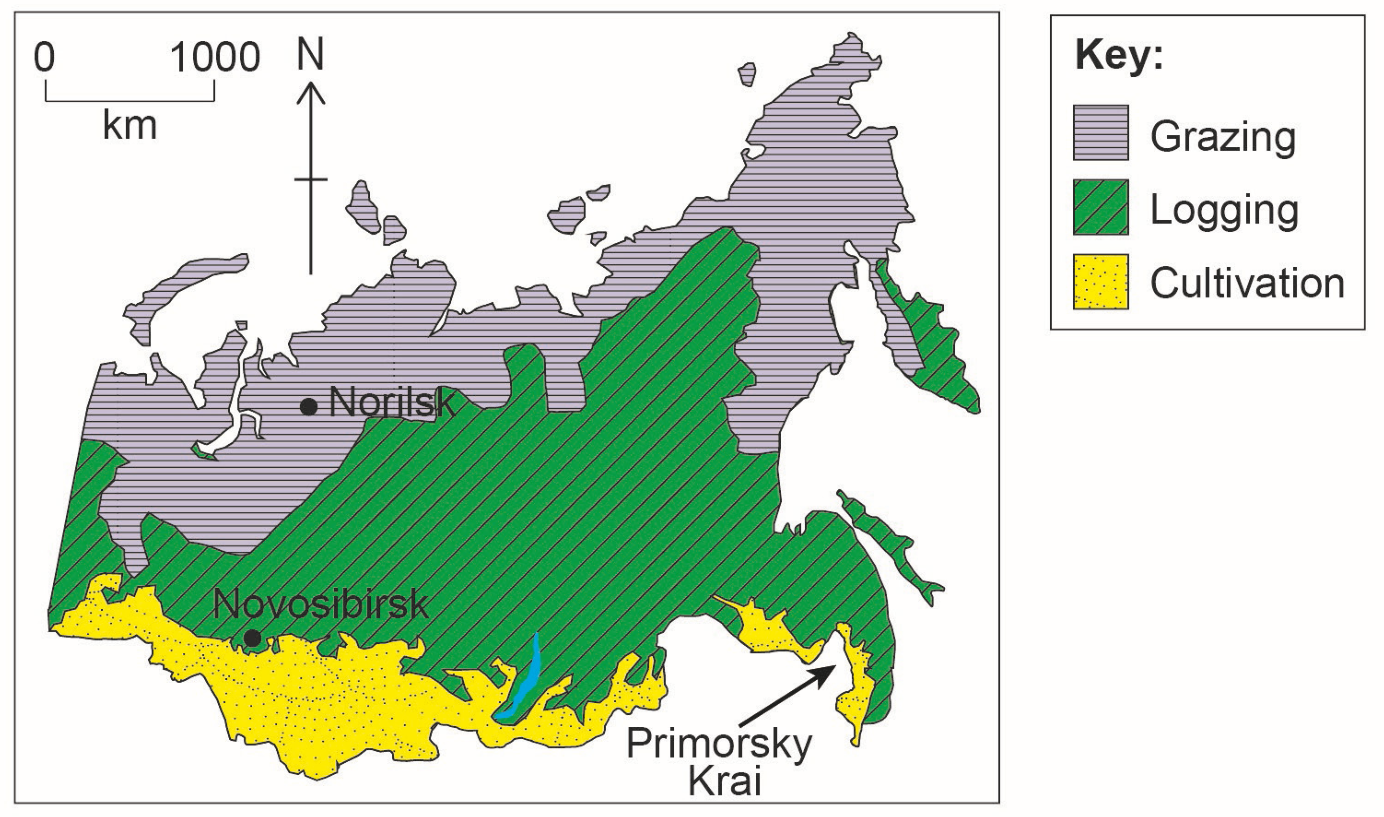
Figure 2(c): Dominant agricultural activities in Siberia, Russia
Using Figures 2(a) and 2(c), identify the agricultural activity that covers the greatest area in the taiga.
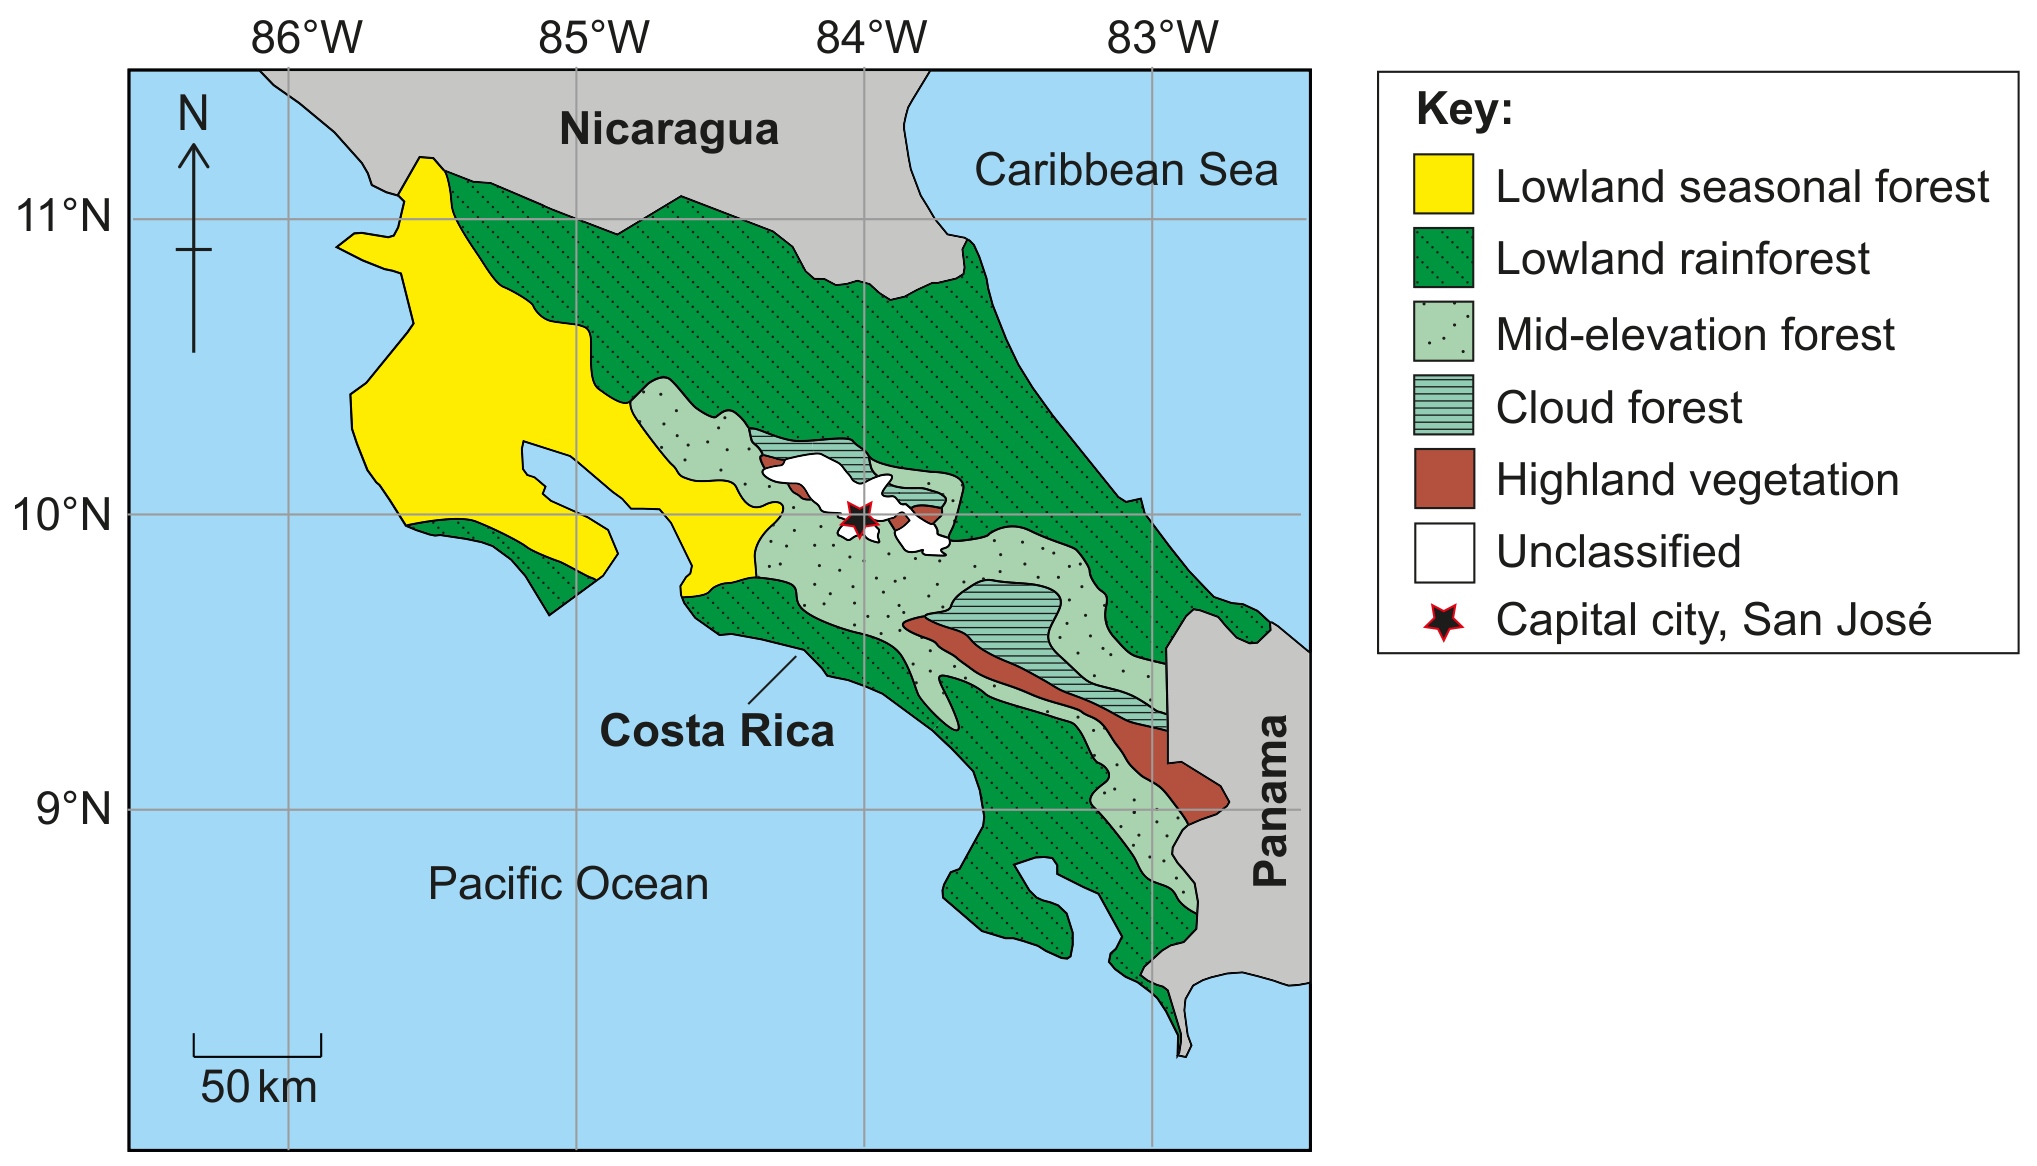
Figure 3(a): Main vegetation zones in Costa Rica
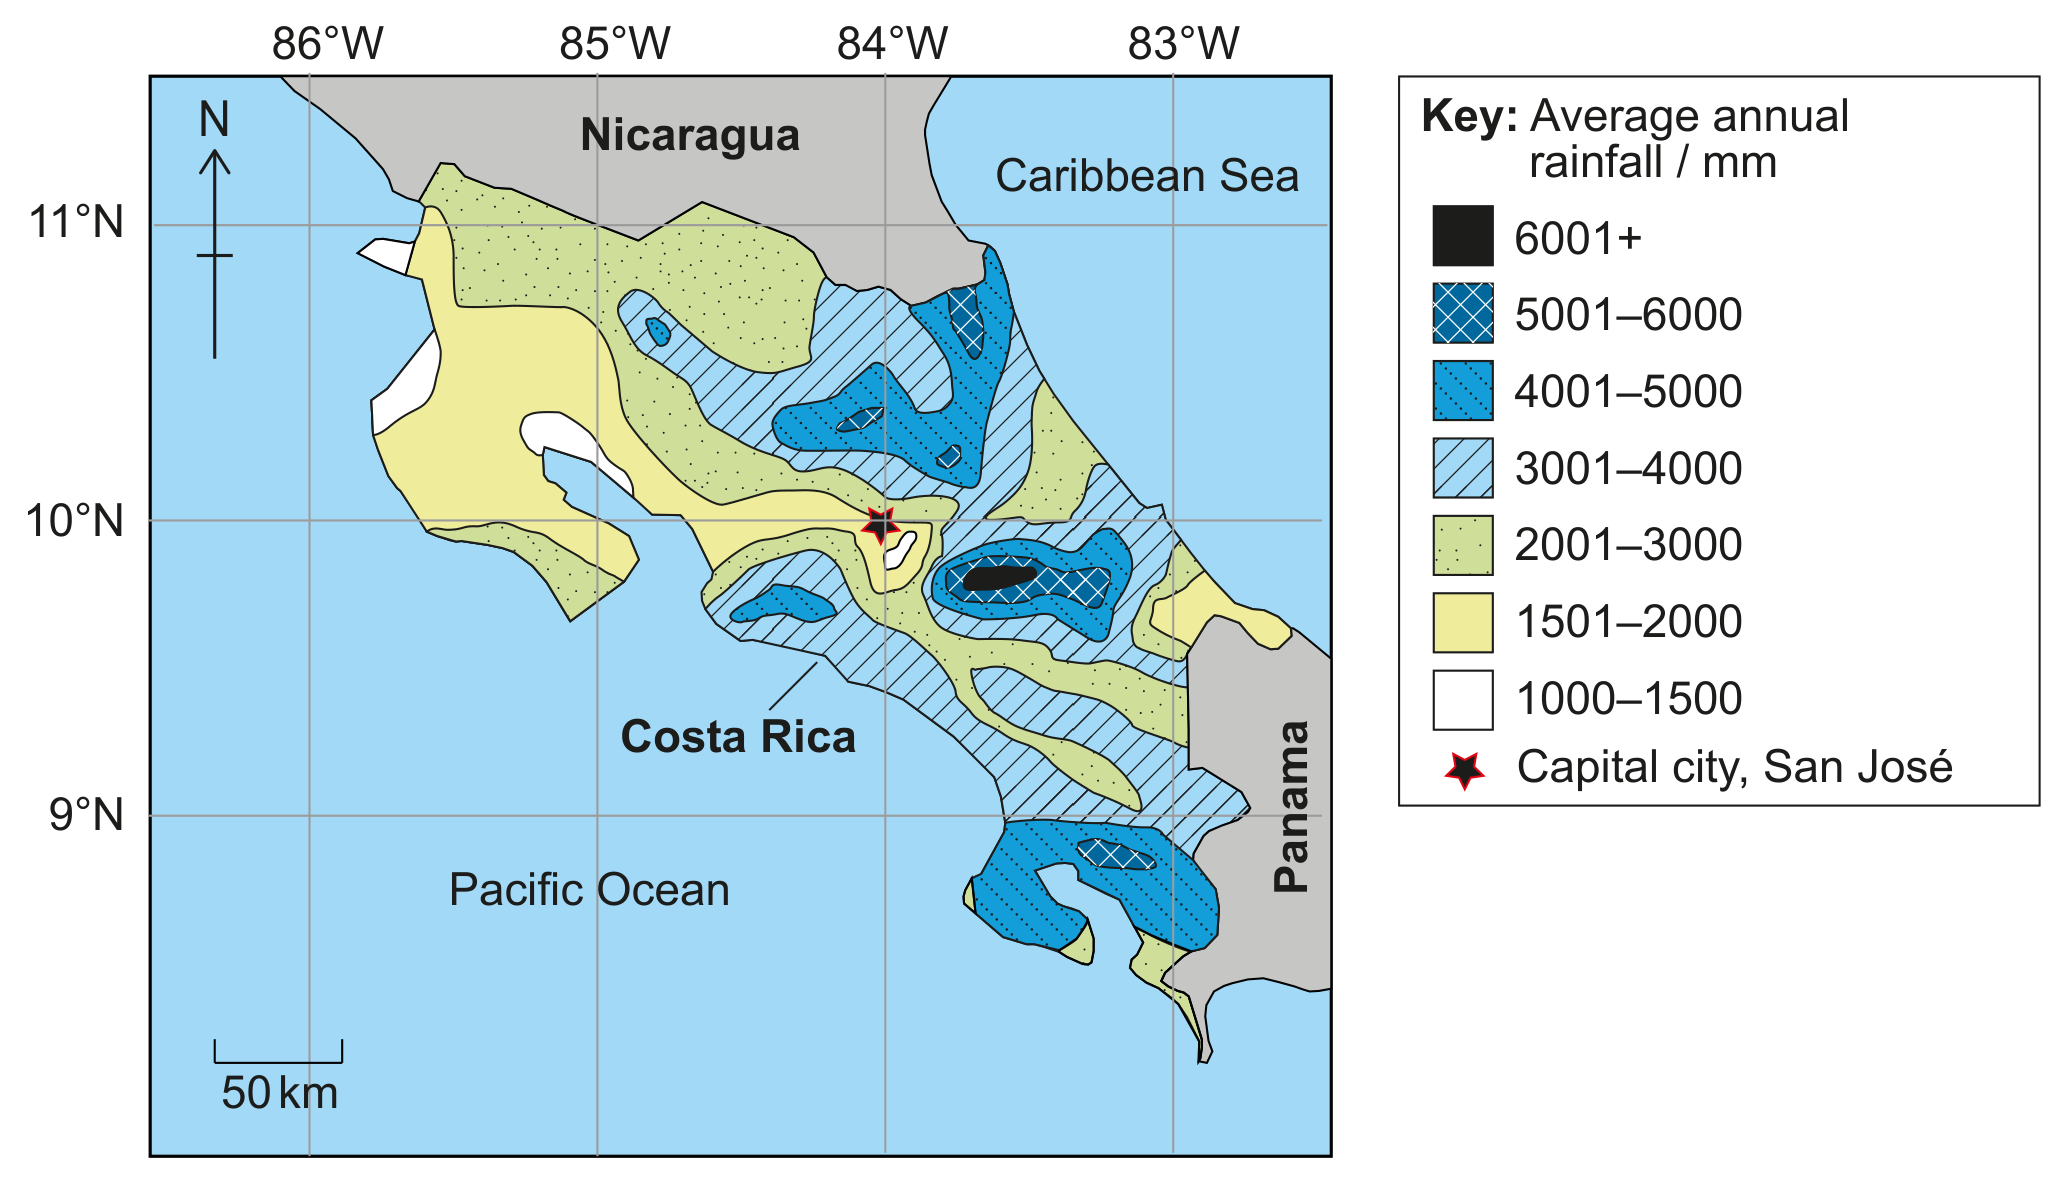
Figure 3(c): Average annual rainfall in Costa Rica
With reference to Figures 3(a), 3(b) and 3(c), identify the climatic conditions in lowland seasonal forest.
Suggest two factors that may have contributed to the severe Amazon droughts of 2005 and 2010.
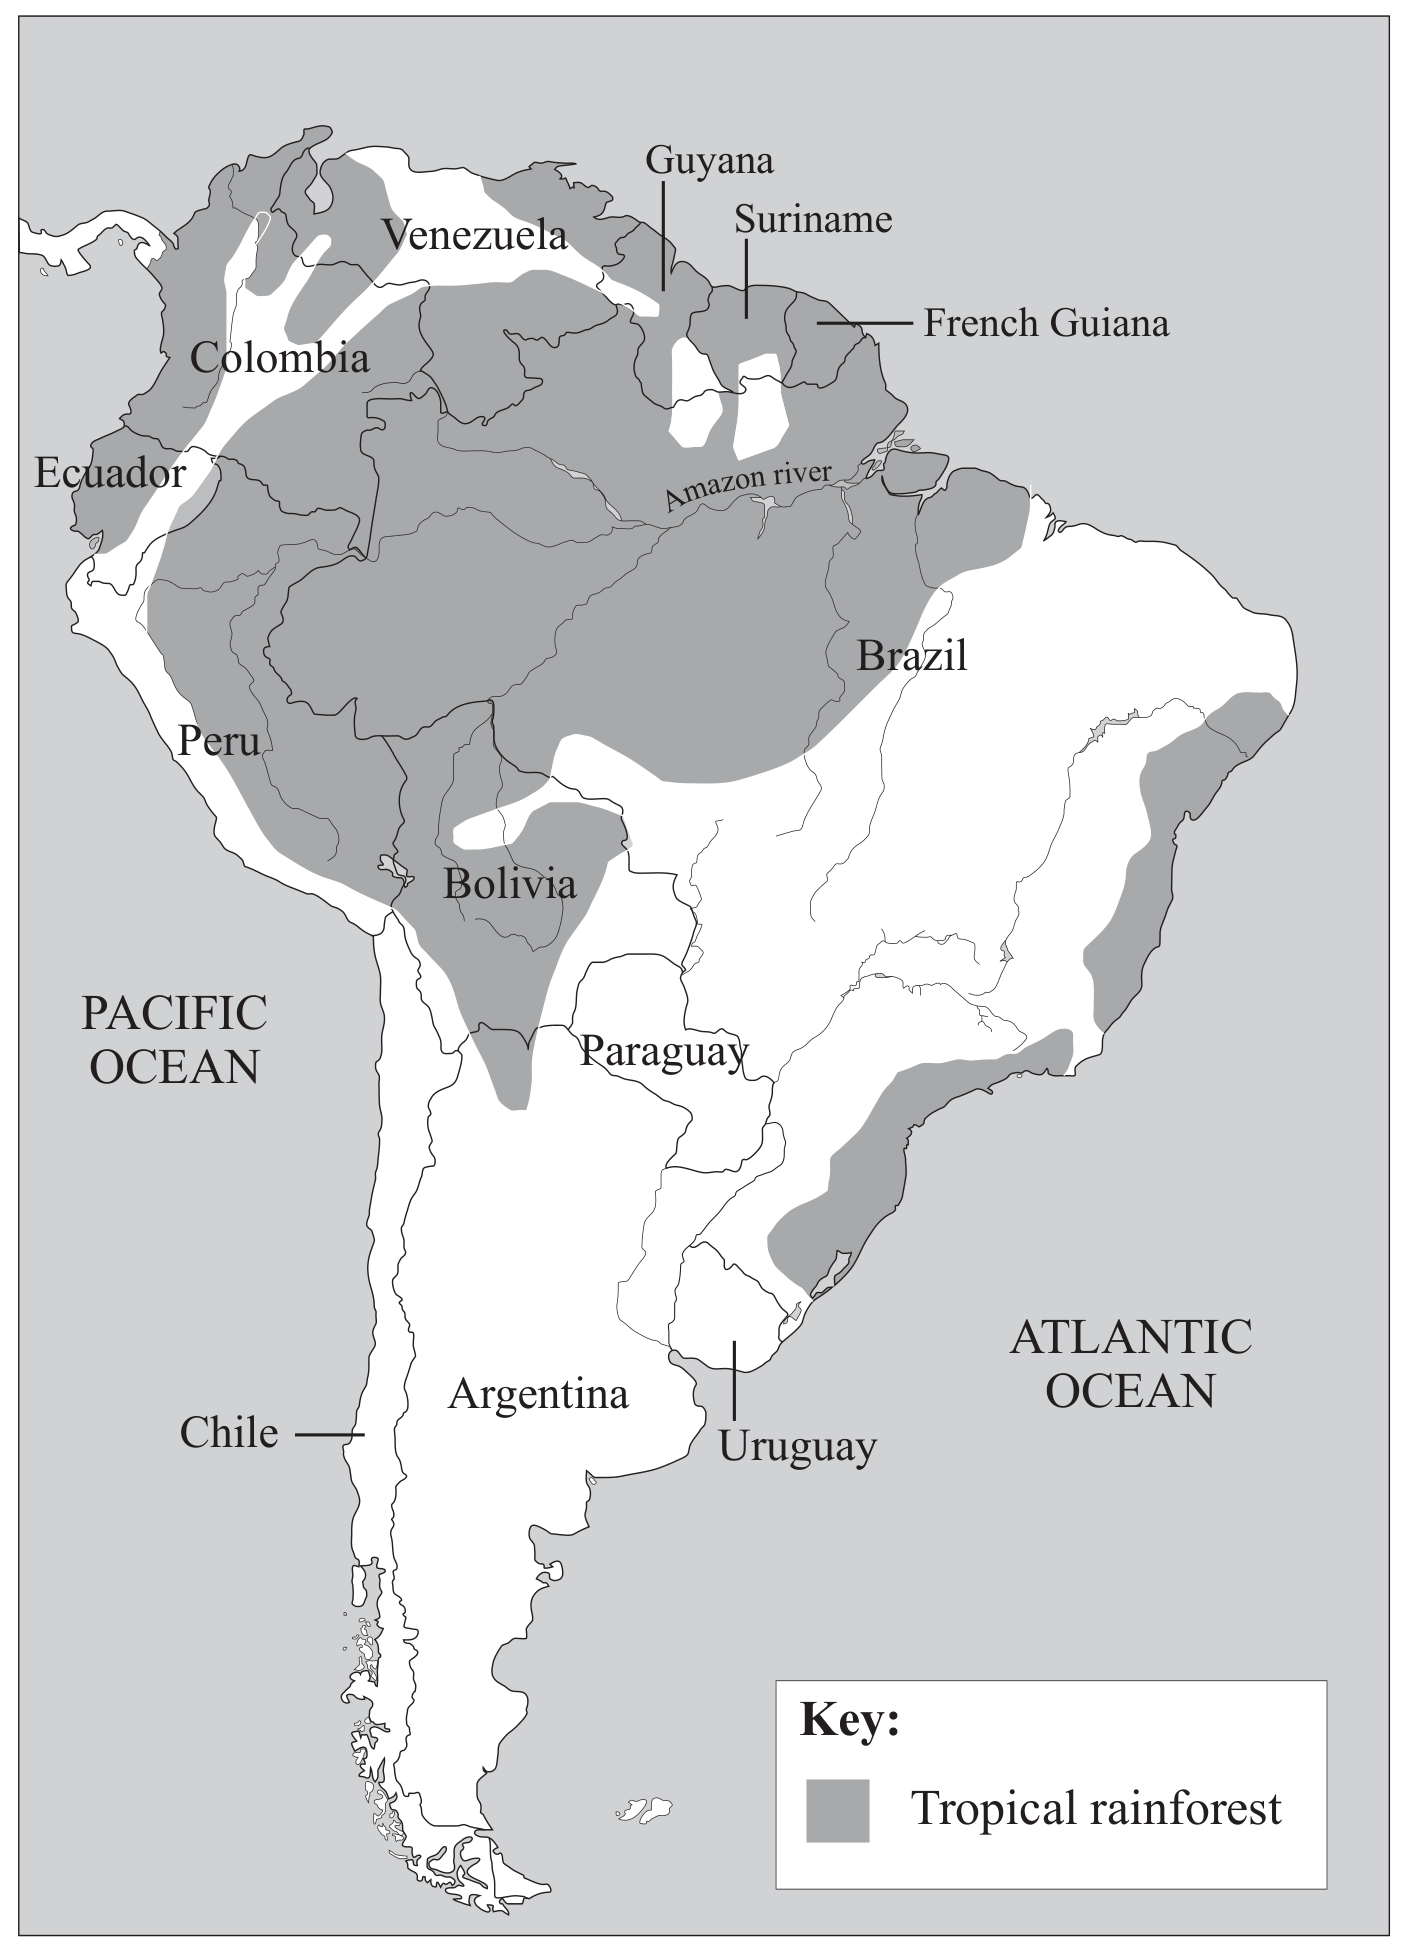
Figure 8: Amazon Tropical Rainforest and drought information
Figure 8: in 2005 and 2010 severe droughts caused many smaller rivers flowing into the Amazon to dry up.
Worldwide, 2010 was the warmest year recorded since records began in 1850.
In drought years, the Amazon rainforest becomes a net emitter of carbon dioxide because trees die and decompose instead of absorbing CO2.
Figure 5: El Nino and La Nina are changes to normal wind patterns in the southern Pacific that affect climate worldwide.
In El Nino years winds do not blow east to west across the Pacific, causing excess rainfall on the South American coast and droughts in Australia and Indonesia.
La Nina events follow strong El Nino events; eastern Pacific ocean temperature is unusually cold after being unusually hot.
With reference to Figure 3, identify the type of biome found in Iraq.
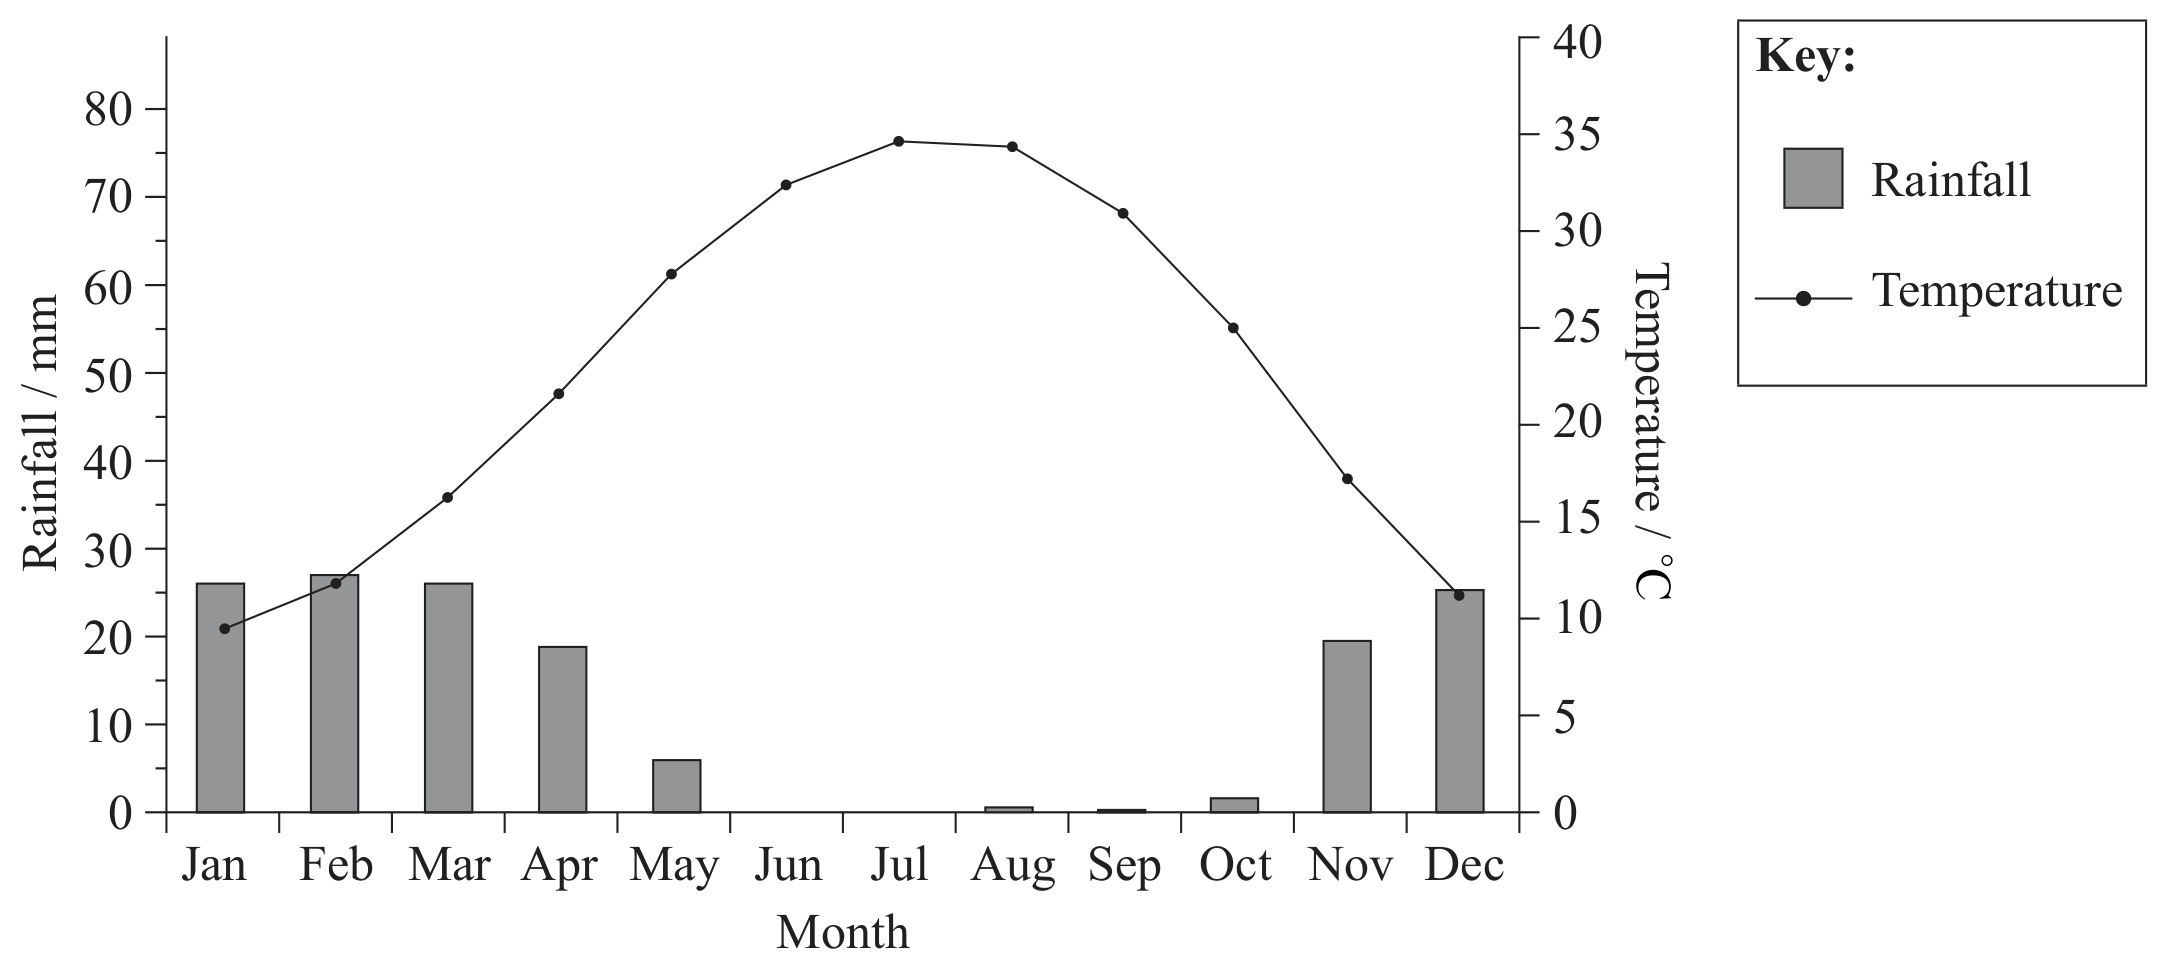
Figure 3: Climate graph of Baghdad, Iraq
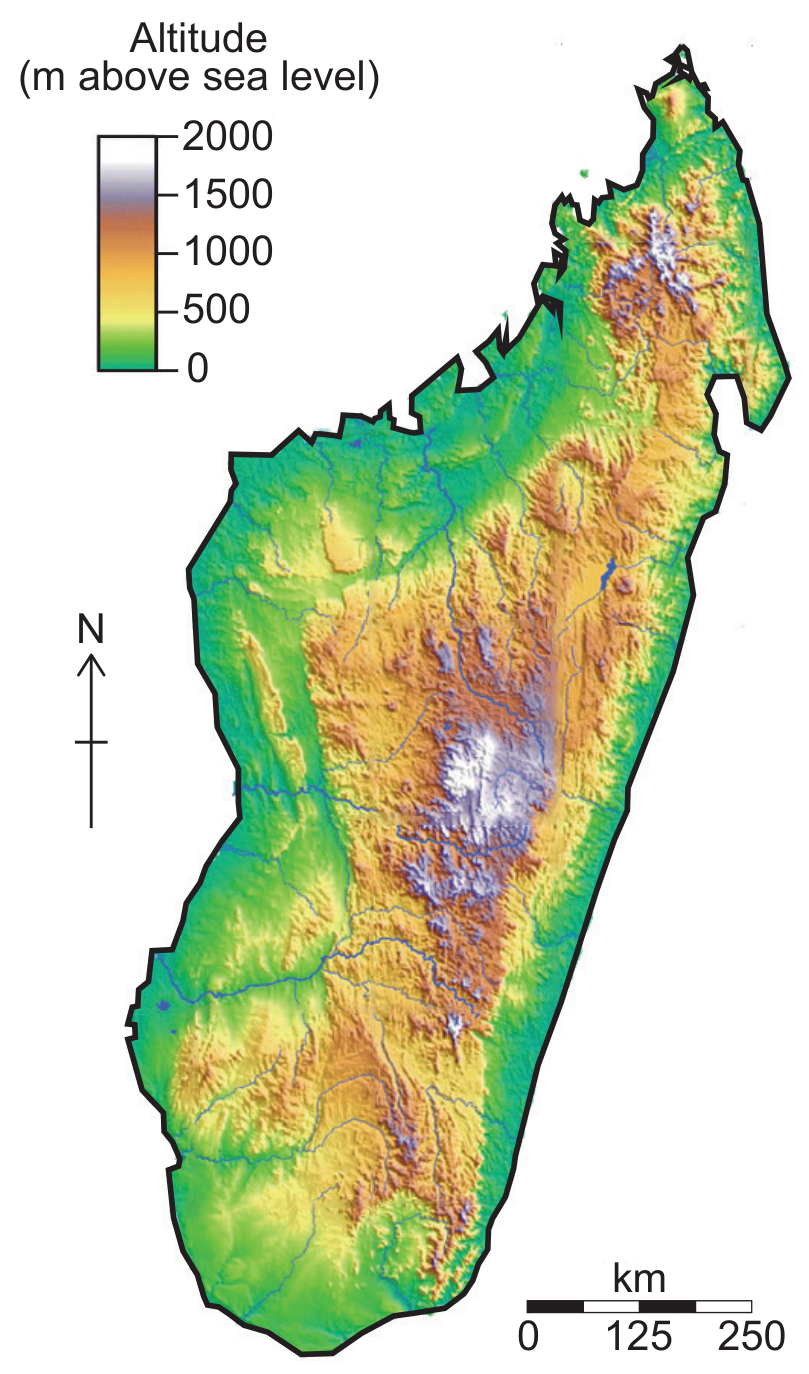
Figure 1(b): Topographic map of Madagascar
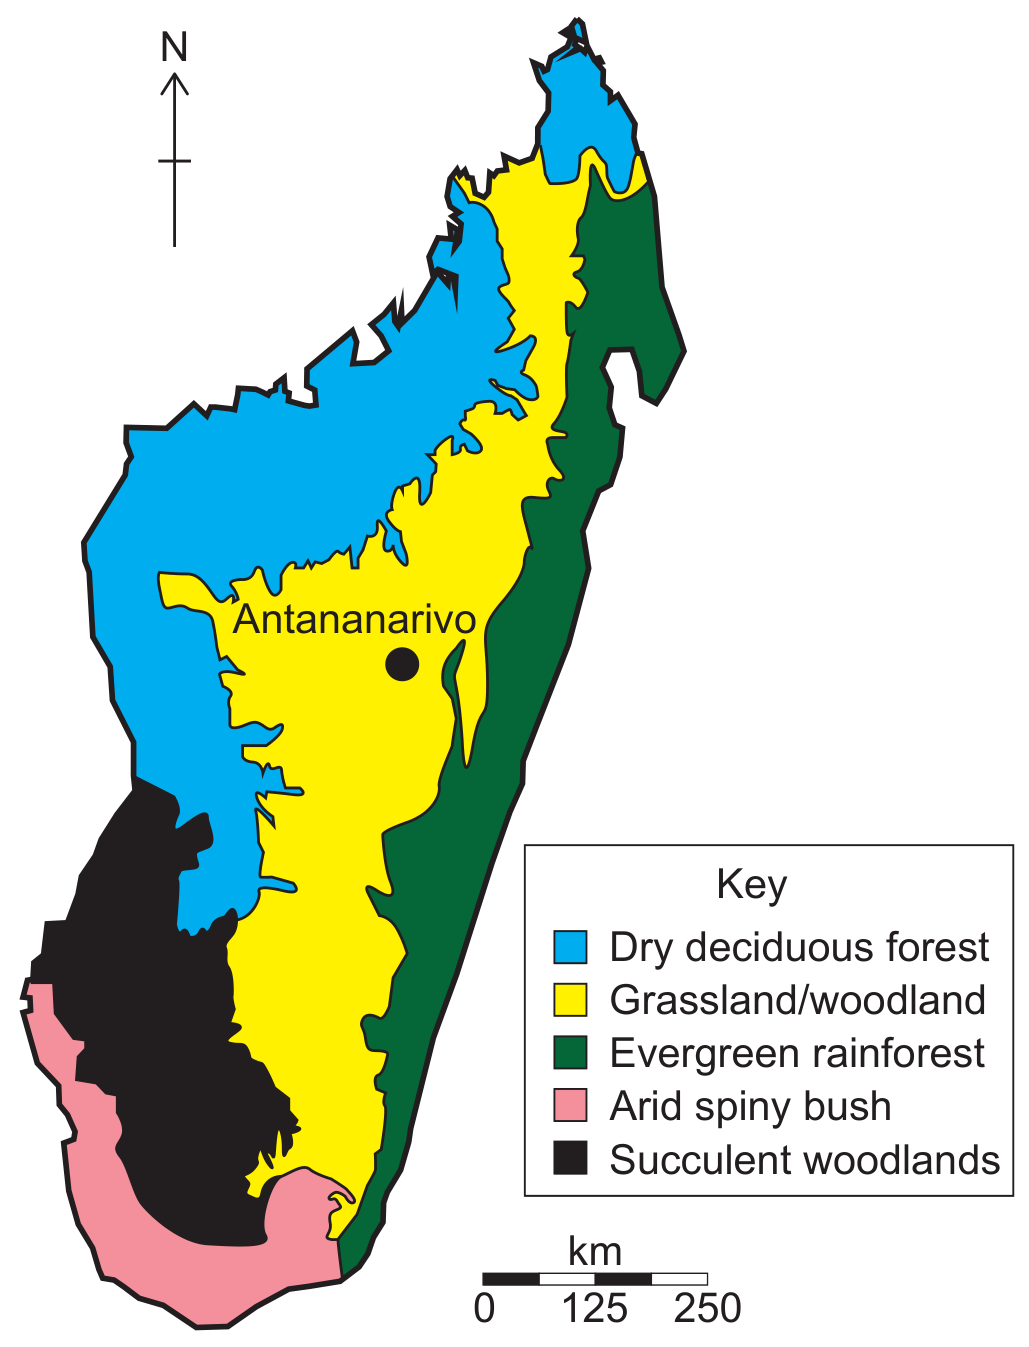
Figure 1(c): Biomes within Madagascar
With reference to Figures 1(b) and 1(c), identify the biome found at the highest altitude in Madagascar.