Question 1
[Maximum number: 3]
The concentration of DDT at different trophic levels of the food chain.
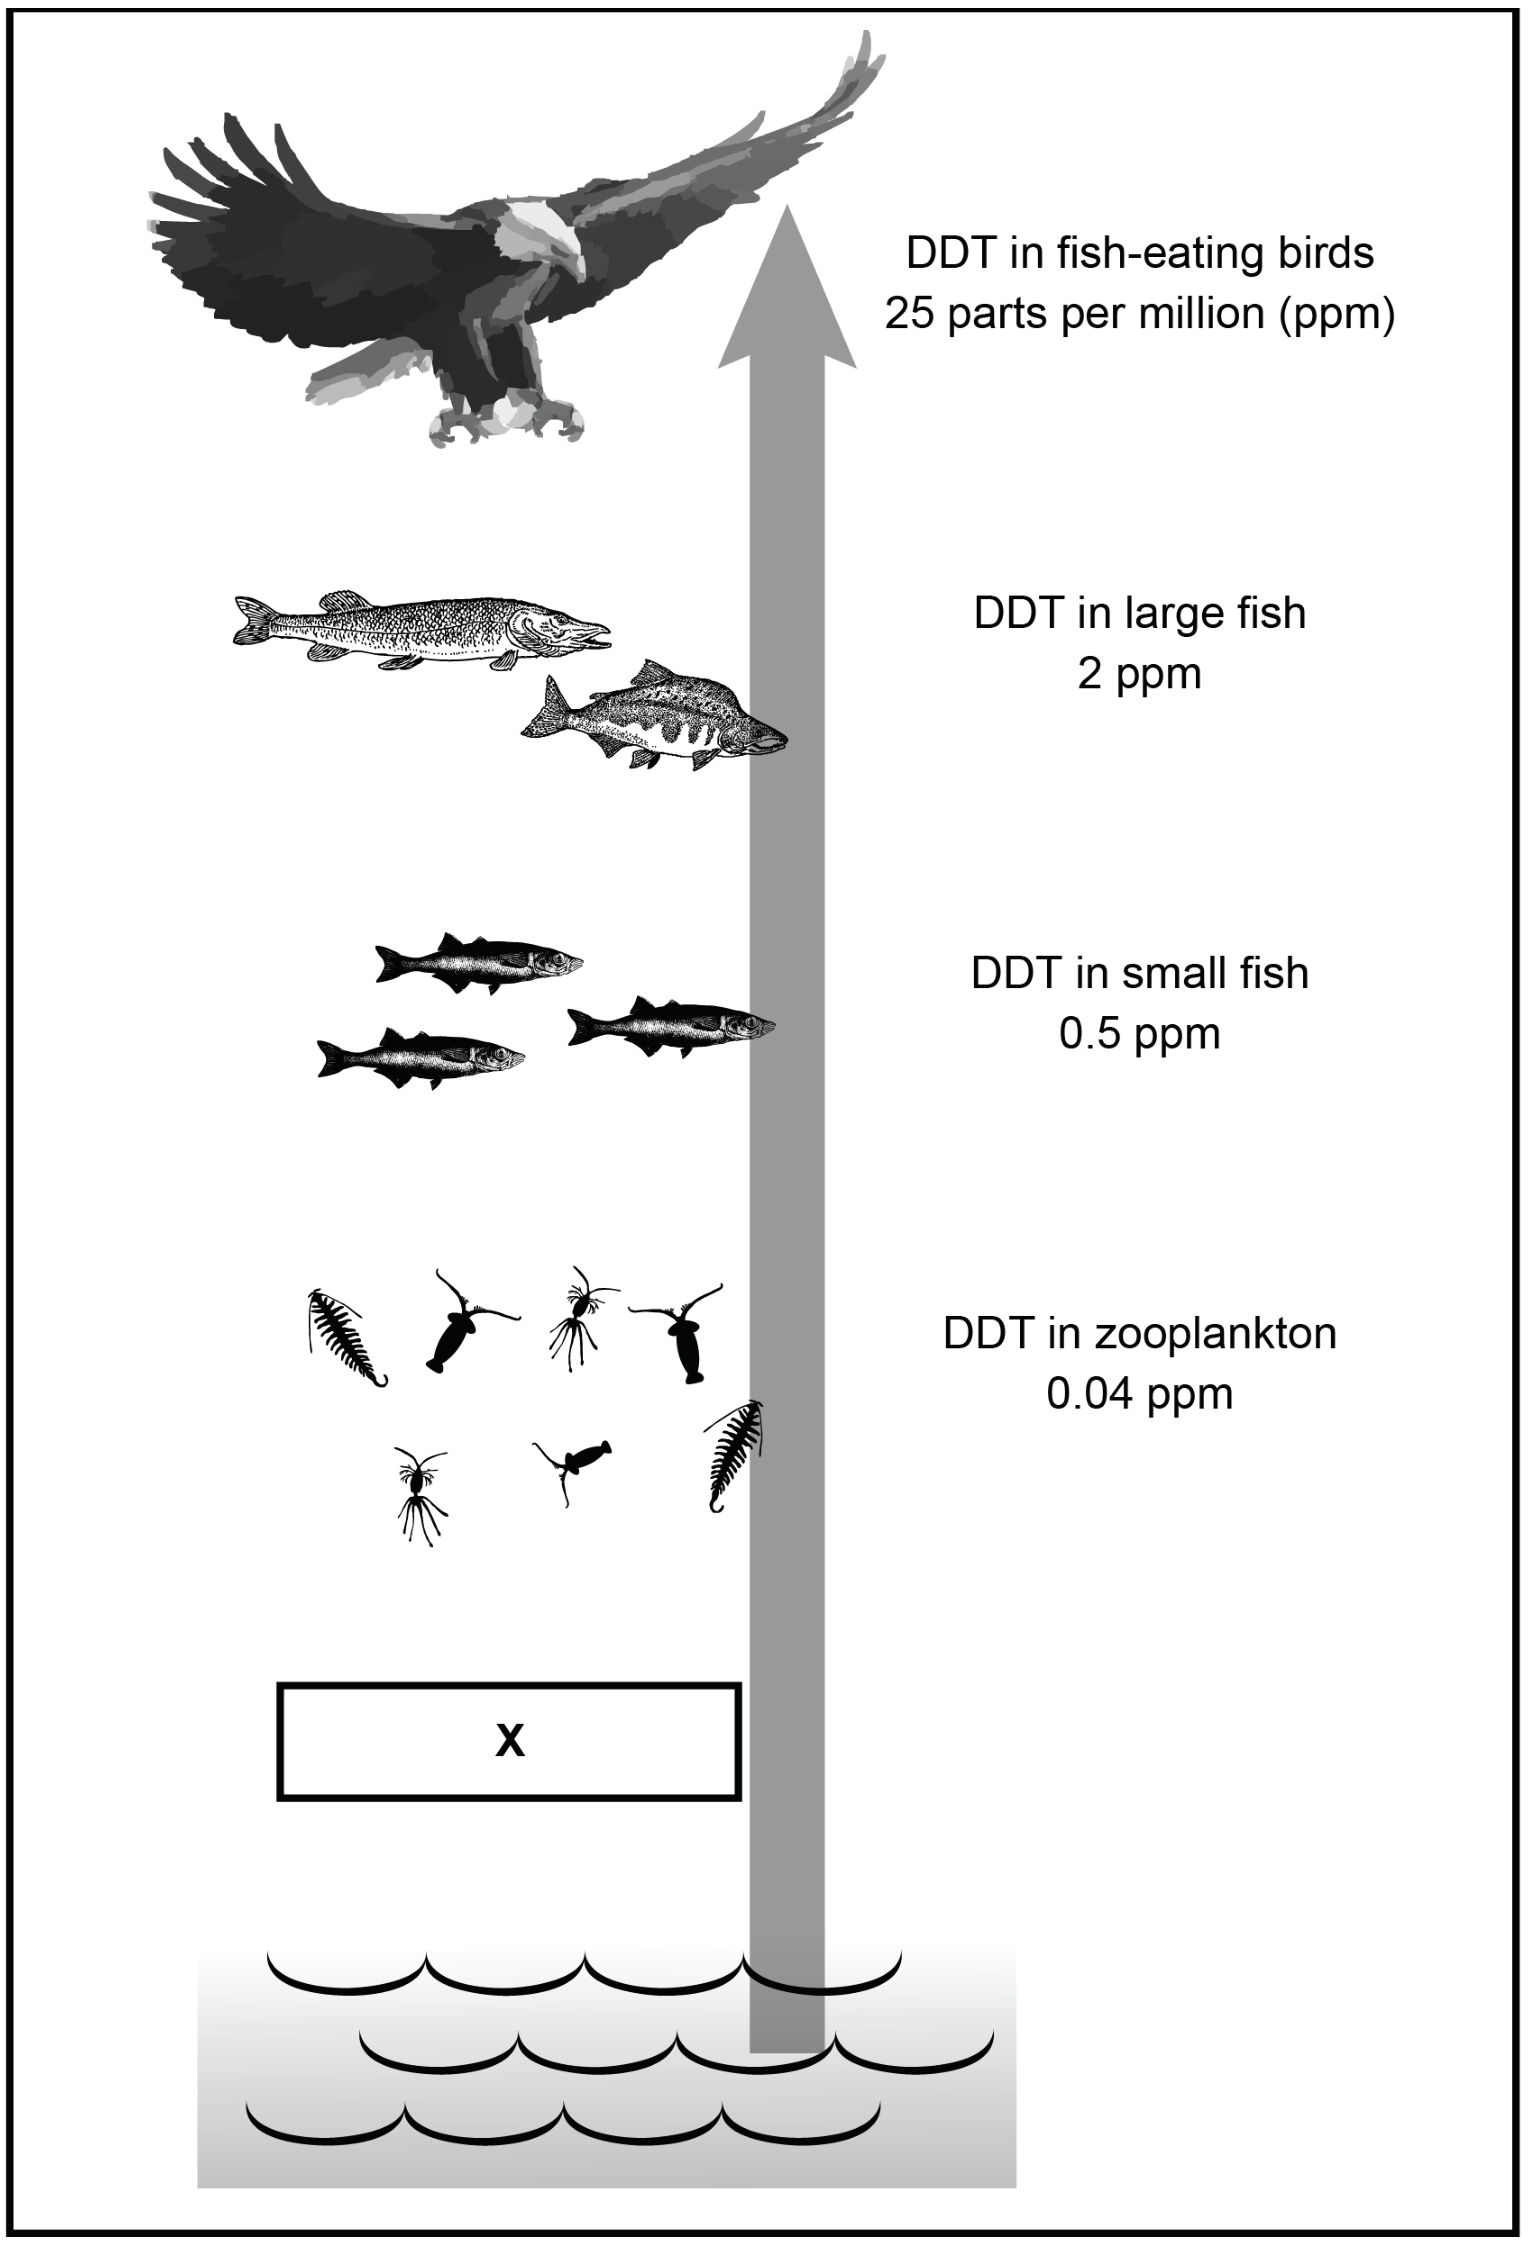
Figure 1: Levels of concentration of DDT in food chain
Question 1(e)
Question 1(e)(i)
(a)
(i)
State the relationship between large and small fish in Figure 1.
[ 1 ]
Question 1(e)(ii)
(ii)
Outline how this relationship may be of benefit to the populations of both species.
[ 2 ]