Question 1
Read the extracts and answer the questions that follow.
Text A — Bangladesh: the economic role of women
(1) Bangladesh is a densely populated country in Asia. Its currency is the Bangladeshi taka (BDT). The annual rate of growth of gross domestic product (GDP) has steadily increased from 5.6 % in 2010 to 8.1 % in 2019. Absolute poverty has declined, but inequality has risen, partly due to higher unemployment rates for women than men. Moreover, the labour force participation rate for women is much lower than the rate for men. Over 80 % of the women's jobs are in the informal economy, and these jobs are low paid and insecure. Women need regular paid work, which not only raises household income but also improves economic well-being in terms of education and health.
(2) The structure of the economy is changing. The growth of cities is due to the expansion of the manufacturing sector, which now contributes a larger share to GDP than the agricultural sector. These changes have increased the number of women in the labour force. In particular, the growth of the ready-made garments (RMG) industry (mass-produced clothing) has given women the opportunity to move into formal employment. The RMG industry provides jobs for almost 4 million low-skilled and semi-skilled workers, accounting for over 40 % of total manufacturing employment. The majority of these jobs are being filled by women, with the result that the gap between the wages of men and women is gradually being reduced.
(3) There are concerns about working and safety conditions in the RMG factories. After an accident in a factory in 2013, reforms are being implemented, partly in response to criticisms from overseas retailers and consumers who purchase the garments. The minimum wage has been increased, inspections are carried out, and there are fewer small, unsafe factories.
(4) While working conditions are improving, such reforms raise the costs of manufacturing garments. Furthermore, the international garment market is becoming more competitive, putting pressure on Bangladeshi factories to reduce costs.
(5) The overseas demand for Bangladeshi garments had been rising strongly until 2019. However, demand has recently fallen, reducing firms' revenue. The reduction in revenue and the need to lower costs have forced certain firms to reduce the size of their labour force by dismissing some of their female workers.
(6) The number of ethically and environmentally concerned consumers is increasing globally. Rather than trying to lower costs, firms can be more successful if they produce "green ready-made garments" by implementing sustainable practices. About 100 garment factories in Bangladesh have already been certified as producers that meet specified environmental standards. In addition, global retailers and fashion brands are supporting recycling initiatives through the Circular Fashion Partnership.
Text B - Trade prospects for exports of ready-made garments (RMG)
(1) Exports of RMG account for over 84 % of Bangladesh's total exports. At present, Bangladesh is the world's second largest garment exporter after China. Bangladeshi exports could further increase as Chinese garments become more expensive due to rising wages in China.
(2) Bangladesh is designated as an Economically Least Developed Country (ELDC) and is therefore able to sell goods in Europe and China without any quotas or tariffs being imposed. However, Bangladesh will graduate from ELDC status by 2026 and will then no longer be eligible for preferential trade agreements. Moreover, the USA, which is the largest export market for Bangladeshi garments, has applied a 15 % tariff on imports from Bangladesh since 2013, citing concerns about working conditions in factories.
Text C - Role of foreign direct investment in the RMG sector
(1) Vietnam and Myanmar have significantly increased their garment exports to China due to foreign direct investment (FDI) from China. Chinese investors have set up factories that import raw materials from China and re-export the finished goods back to China.
(2) Consequently, to compete successfully in the huge Chinese market, Bangladesh needs to attract more FDI from China. Bangladesh is developing the required infrastructure, such as transport links. It is also necessary to diversify into expensive high-end fashion, market more aggressively, and use branding strategies.
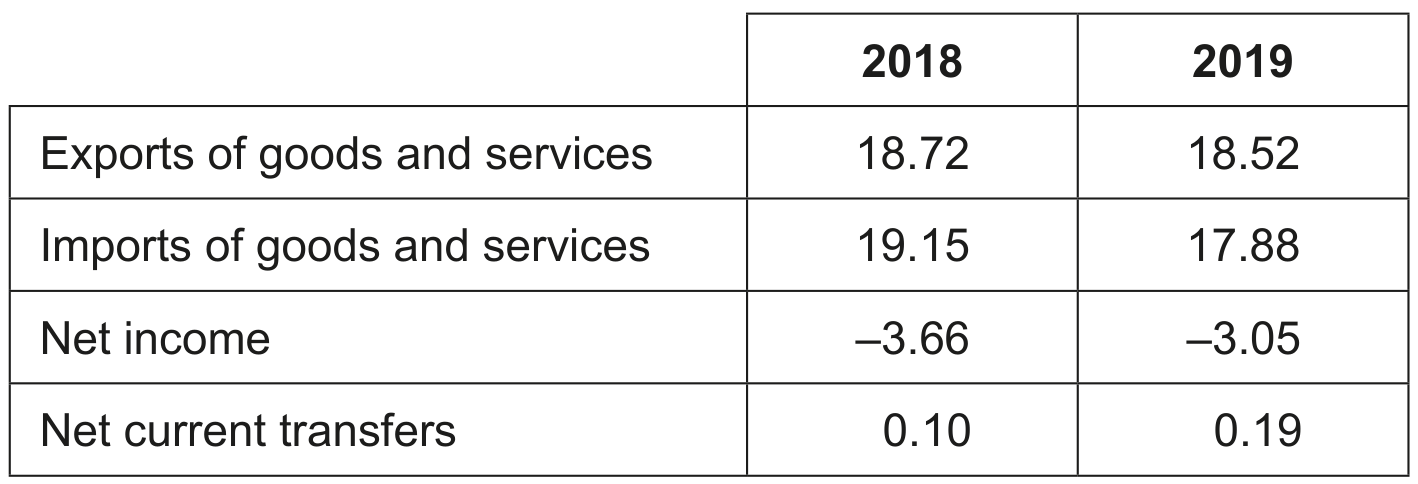
(3) The funds from additional FDI would be helpful, because the relative contribution of Official Development Assistance (ODA) to Bangladesh's budget is declining. Furthermore, the foreign exchange obtained from foreign investors assists in financing the current account deficit.
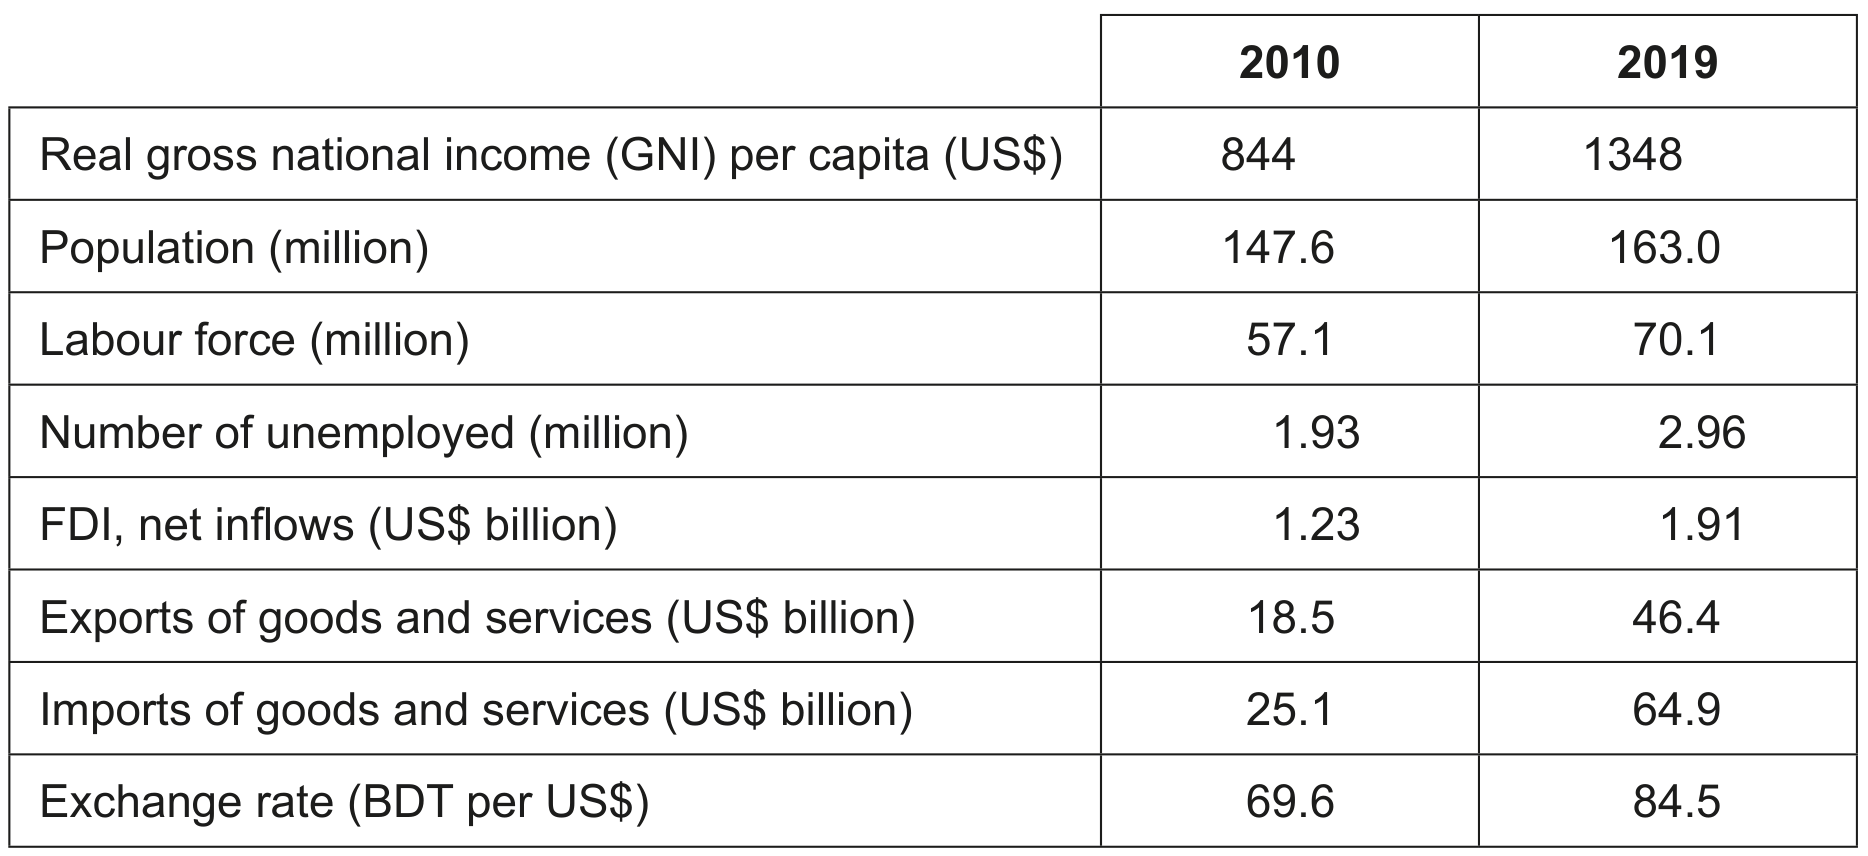
Table 1: Economic data for Bangladesh
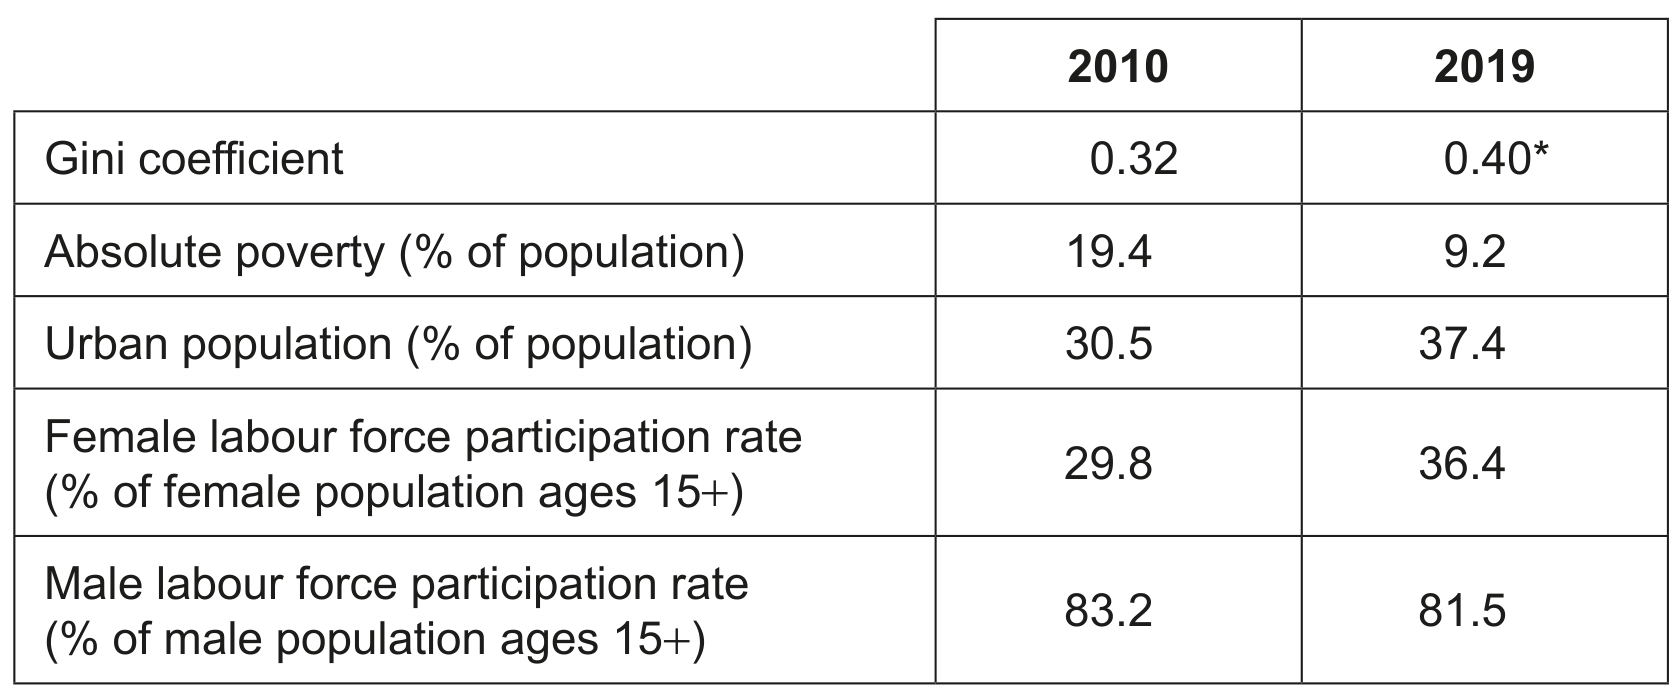
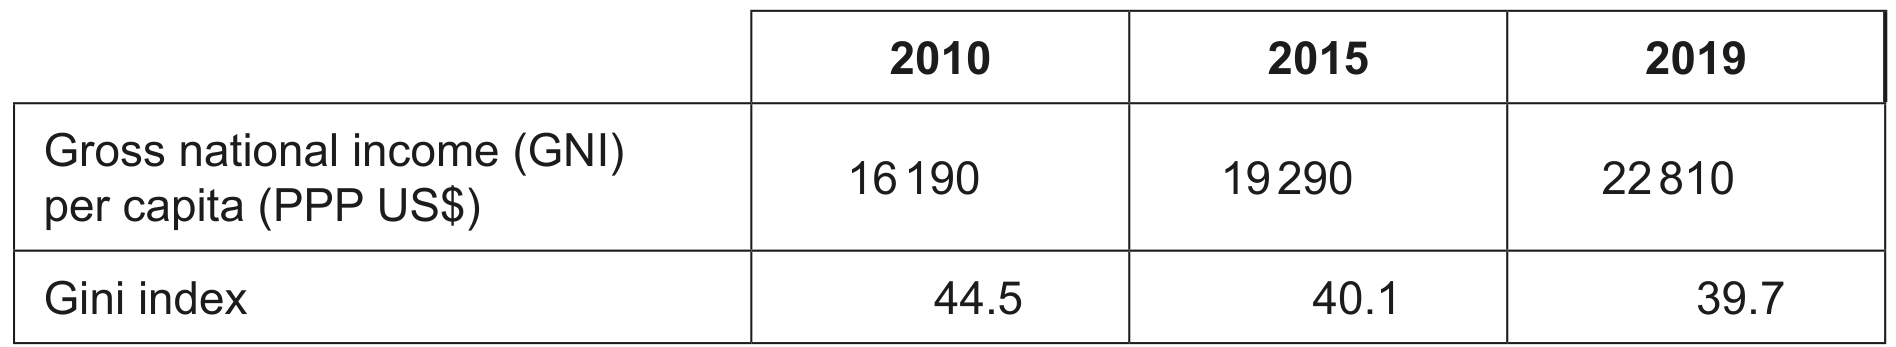
Table 2: Development data for Bangladesh
*estimate
Question 1(a)
Question 1(a)(i)
Define the term absolute poverty indicated in bold in the text (Text A, paragraph 1).
Question 1(f)
Using a Lorenz curve diagram, explain what happened to the distribution of income in Bangladesh between 2010 and 2019 (Table 2).