EduNinja

IB Chemistry HL2.2 Rate of chemical changeQuestion Bank

Question 1

[Maximum number: 3]

A student investigated how the type of acid in acid deposition affects limestone, a building material mainly composed of calcium carbonate.

Table

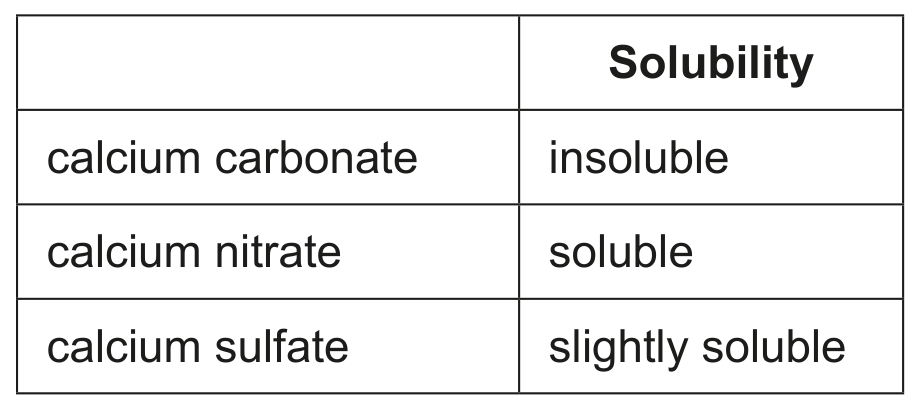
The student monitored the mass of six similarly sized pieces of limestone. Three were placed in beakers containing 200.0 cm3200.0 \mathrm{~cm}^{3} of 0.100 moldm30.100 \mathrm{~mol} \mathrm{dm}^{-3} nitric acid, HNO3(aq)\mathrm{HNO}_{3}(\mathrm{aq}), and the other three in 200.0 cm3200.0 \mathrm{~cm}^{3} of 0.100 moldm30.100 \mathrm{~mol} \mathrm{dm}^{-3} sulfuric acid, H2SO4(aq)\mathrm{H}_{2} \mathrm{SO}_{4}(\mathrm{aq}).

Question image

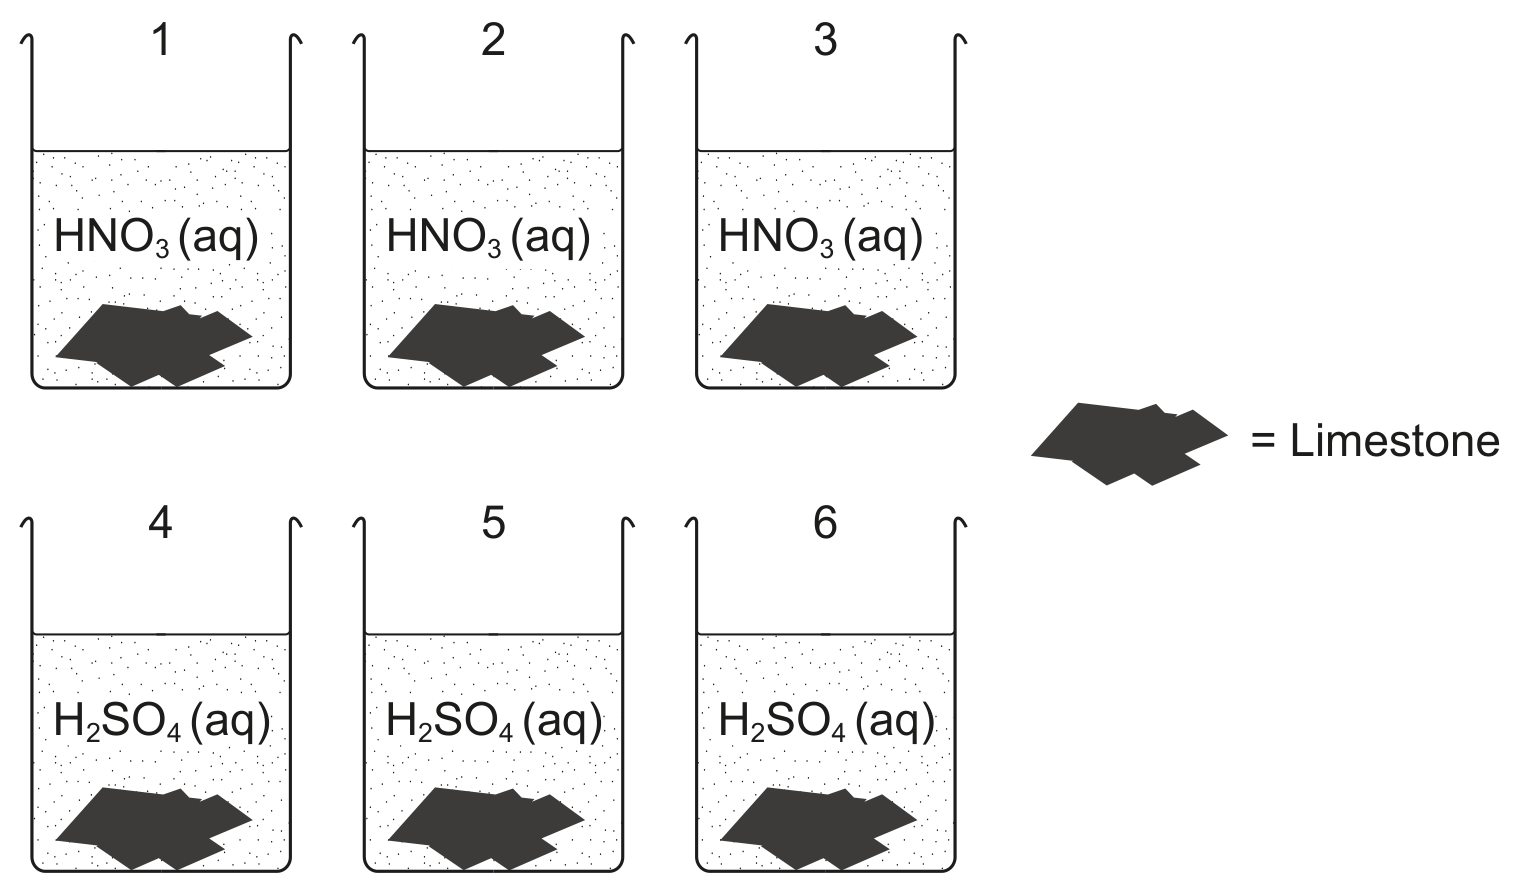
The limestone was removed from the acid, washed, dried with a paper towel and weighed every day at the same time and then replaced in the beakers.

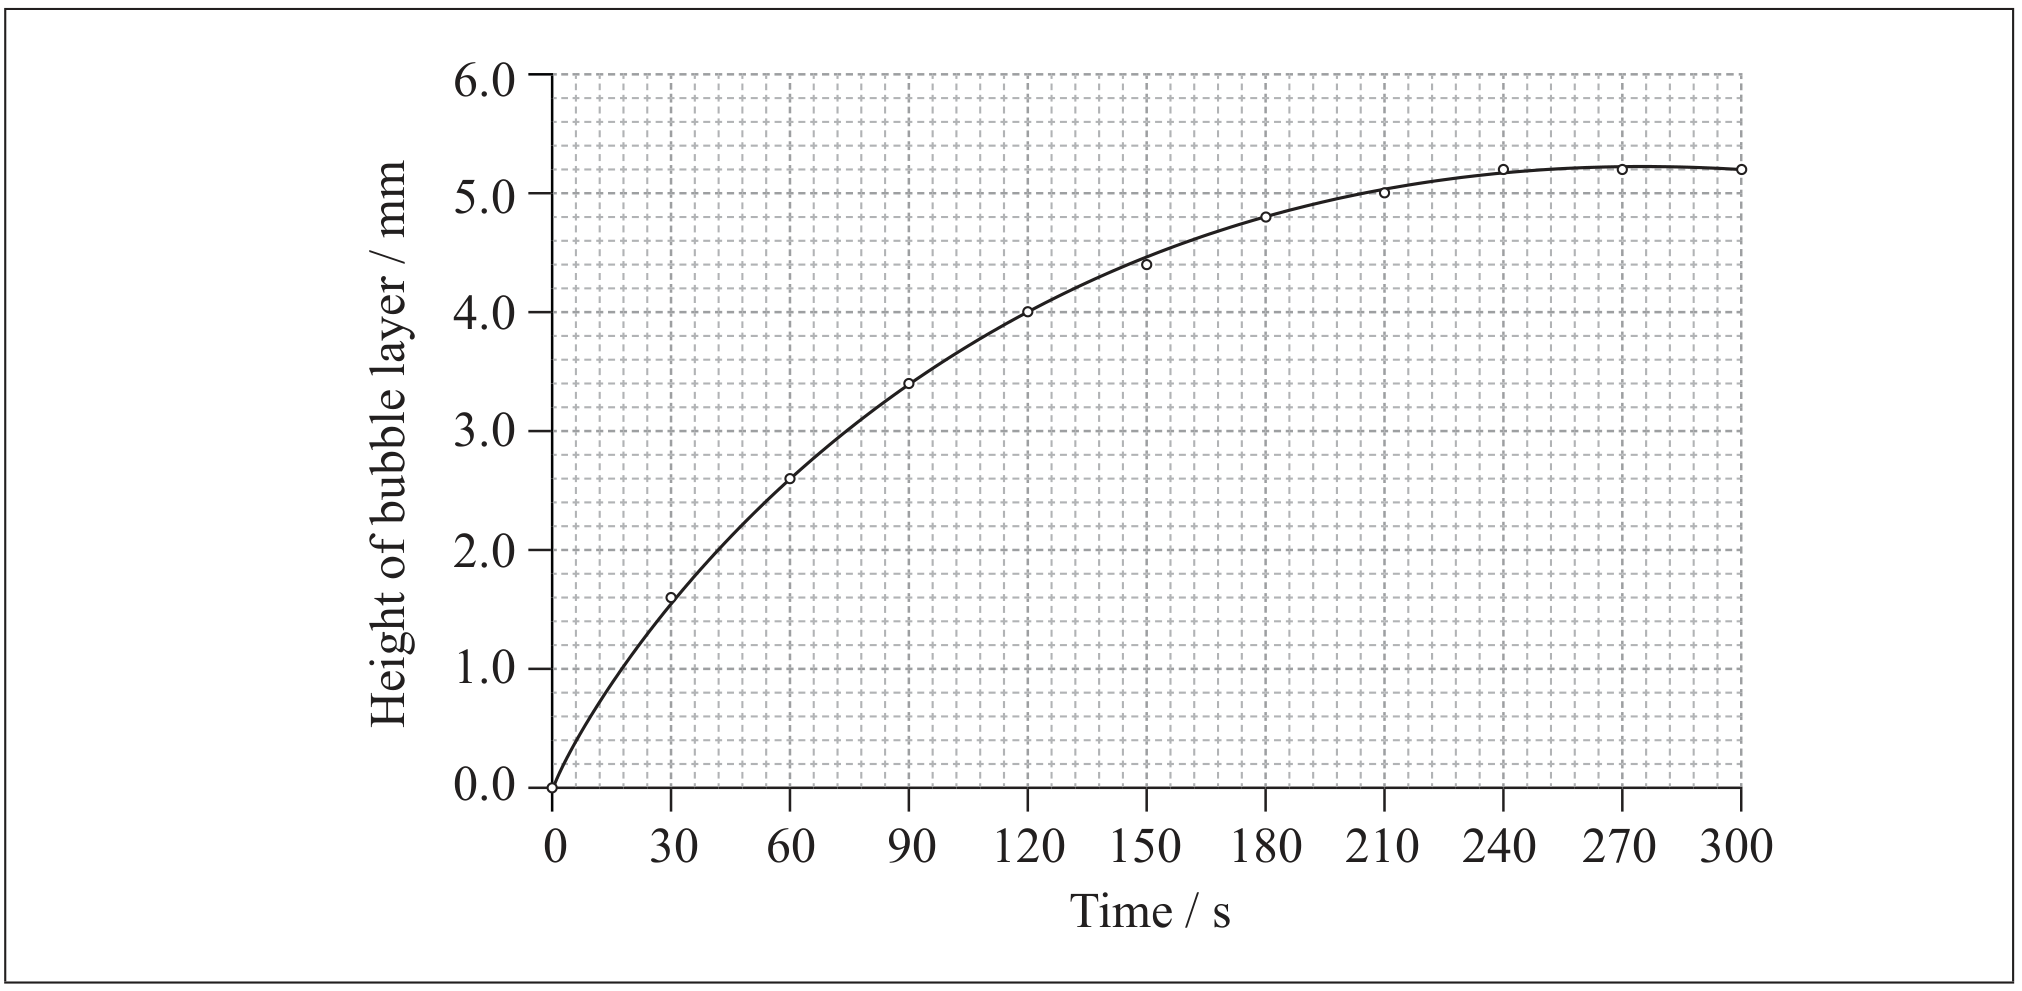
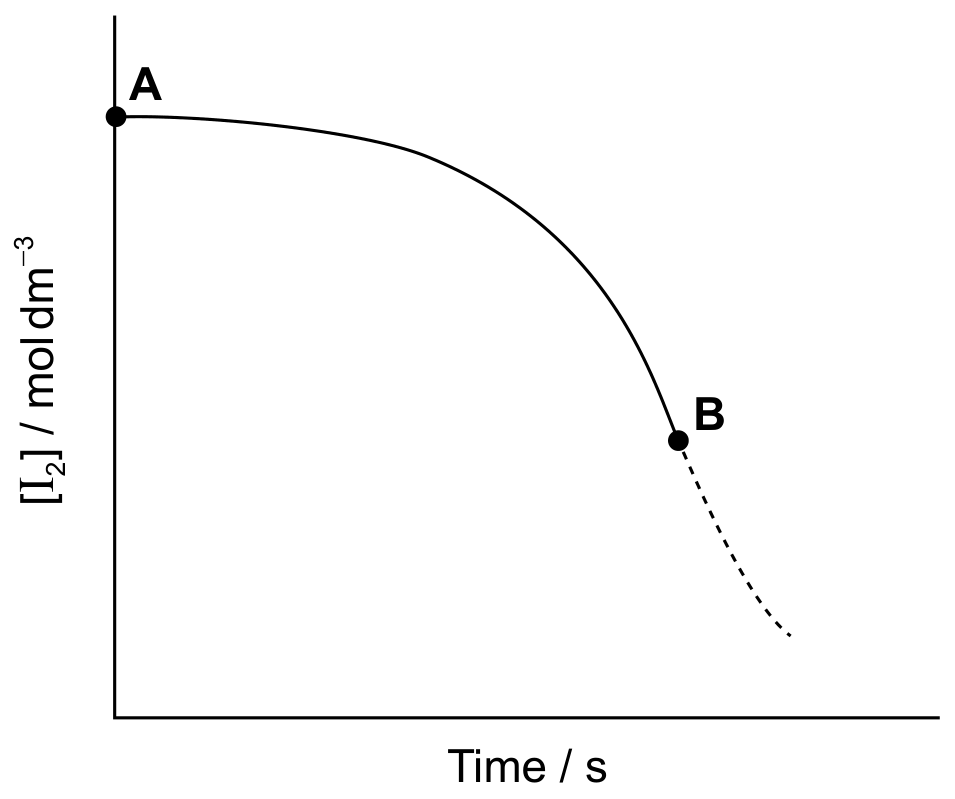
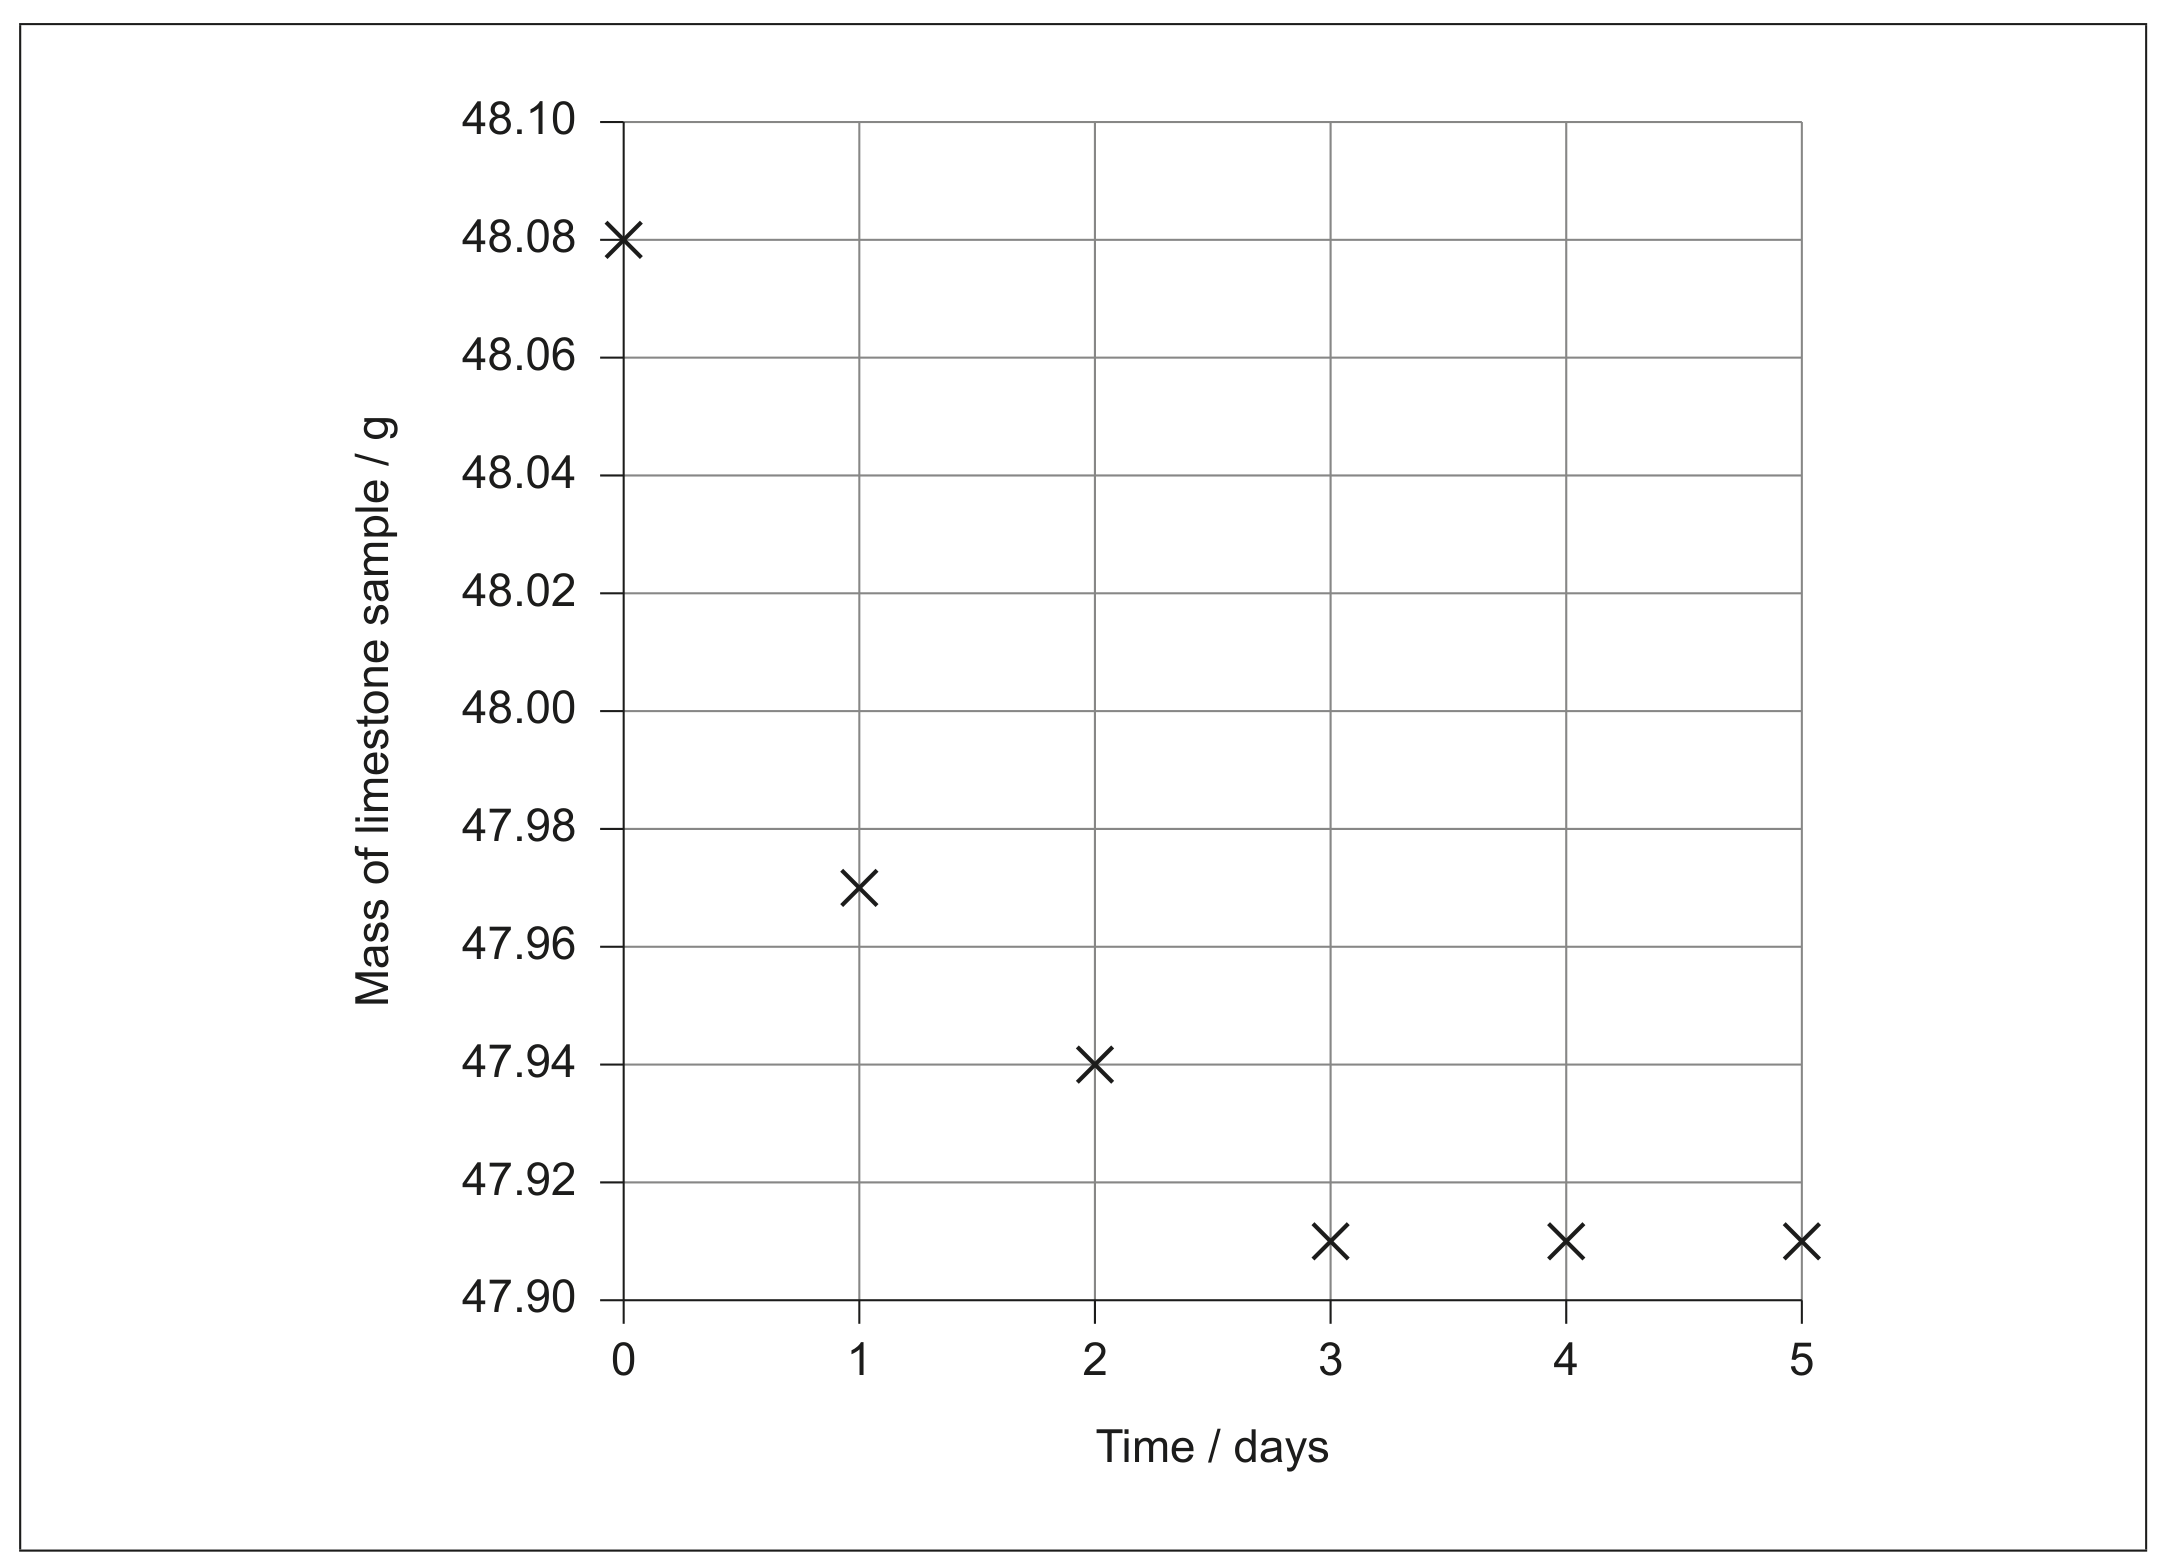
The student plotted the mass of one of the pieces of limestone placed in nitric acid against time.

Question image

Question 1(b)

Question 1(b)(i)

(a)
(i)

Determine the initial rate of reaction of limestone with nitric acid from the graph. Show your working on the graph and include the units of the initial rate.

[ 3 ]

Question 1

[Maximum number: 4]

Hydrogen peroxide, H2O2(aq)\mathrm{H}_{2} \mathrm{O}_{2}(\mathrm{aq}), releases oxygen gas, O2( g)\mathrm{O}_{2}(\mathrm{~g}), as it decomposes according to the equation below.

2H2O2(aq)2H2O(l)+O2( g)2 \mathrm{H}_{2} \mathrm{O}_{2}(\mathrm{aq}) \rightarrow 2 \mathrm{H}_{2} \mathrm{O}(\mathrm{l})+\mathrm{O}_{2}(\mathrm{~g})

50.0 cm350.0 \mathrm{~cm}^{3} of hydrogen peroxide solution was placed in a boiling tube, and a drop of liquid detergent was added to create a layer of bubbles on the top of the hydrogen peroxide solution as oxygen gas was released. The tube was placed in a water bath at 75C75^{\circ} \mathrm{C} and the height of the bubble layer was measured every thirty seconds. A graph was plotted of the height of the bubble layer against time.

Question image

Question 1(a)

(a)

Explain why the curve reaches a maximum.

[ 1 ]

Question 1(b)

(b)

Use the graph to calculate the rate of decomposition of hydrogen peroxide at 120 s .

[ 3 ]

Question 1

[Maximum number: 10]

Propanone reacts with bromine in acidic solution according to the following equation.

CH3COCH3(aq)+Br2(aq)H+(aq)BrCH2COCH3(aq)+HBr(aq)\mathrm{CH}_{3} \mathrm{COCH}_{3}(\mathrm{aq})+\mathrm{Br}_{2}(\mathrm{aq}) \xrightarrow{\mathrm{H}^{+}(\mathrm{aq})} \mathrm{BrCH}_{2} \mathrm{COCH}_{3}(\mathrm{aq})+\mathrm{HBr}(\mathrm{aq})

A student investigated the kinetics of this reaction using data logging equipment. Her data are shown below.

Table

Question 1(a)

Question 1(a)(ii)

(a)
(i)

Calculate the rate of reaction for Experiment 5 and comment on the precision of your result.

[ 2 ]

Question 1(b)

Question 1(b)(i)

(b)
(i)

Deduce the order of reaction with respect to CH3COCH3,Br2\mathrm{CH}_{3} \mathrm{COCH}_{3}, \mathrm{Br}_{2} and H+\mathrm{H}^{+}.

[ 3 ]

Question 1(b)(ii)

(ii)

Deduce the rate expression for the reaction. Calculate the rate constant and state its units.

[ 3 ]

Question 1(c)

(c)

The student proposed the following mechanism for this reaction.

Br22Br Slow 2Br+CH3COCH3BrCH2COCH3+HBr Fast \begin{array}{lc} \mathrm{Br}_{2} \rightarrow 2 \mathrm{Br} \bullet & \text { Slow } \\ 2 \mathrm{Br} \bullet+\mathrm{CH}_{3} \mathrm{COCH}_{3} \rightarrow \mathrm{BrCH}_{2} \mathrm{COCH}_{3}+\mathrm{HBr} & \text { Fast } \end{array}

Comment on whether or not the order with respect to bromine supports this hypothesis.

[ 2 ]

Question 1

[Maximum number: 11]

Reaction kinetics can be investigated using the iodine clock reaction. The equations for two reactions that occur are given below.

 Reaction A:H2O2(aq)+2I(aq)+2H+(aq)I2(aq)+2H2O(l) Reaction B:I2(aq)+2 S2O32(aq)2I(aq)+S4O62(aq)\begin{array}{ll} \text { Reaction } \mathrm{A}: & \mathrm{H}_{2} \mathrm{O}_{2}(\mathrm{aq})+2 \mathrm{I}^{-}(\mathrm{aq})+2 \mathrm{H}^{+}(\mathrm{aq}) \rightarrow \mathrm{I}_{2}(\mathrm{aq})+2 \mathrm{H}_{2} \mathrm{O}(\mathrm{l}) \\ \text { Reaction } \mathrm{B}: & \mathrm{I}_{2}(\mathrm{aq})+2 \mathrm{~S}_{2} \mathrm{O}_{3}{ }^{2-}(\mathrm{aq}) \rightarrow 2 \mathrm{I}^{-}(\mathrm{aq})+\mathrm{S}_{4} \mathrm{O}_{6}{ }^{2-}(\mathrm{aq}) \end{array}

Reaction B is much faster than reaction A , so the iodine, I2\mathrm{I}_{2}, formed in reaction A immediately reacts with thiosulfate ions, S2O32\mathrm{S}_{2} \mathrm{O}_{3}{ }^{2-}, in reaction B , before it can react with starch to form the familiar blue-black, starch-iodine complex.

In one experiment the reaction mixture contained:
5.0±0.1 cm35.0 \pm 0.1 \mathrm{~cm}^{3} of 2.00 moldm32.00 \mathrm{~mol} \mathrm{dm}^{-3} hydrogen peroxide (H2O2)\left(\mathrm{H}_{2} \mathrm{O}_{2}\right)5.0±0.1 cm35.0 \pm 0.1 \mathrm{~cm}^{3} of 1 % aqueous starch
20.0±0.1 cm320.0 \pm 0.1 \mathrm{~cm}^{3} of 1.00 moldm31.00 \mathrm{~mol} \mathrm{dm}^{-3} sulfuric acid (H2SO4)\left(\mathrm{H}_{2} \mathrm{SO}_{4}\right)20.0±0.1 cm320.0 \pm 0.1 \mathrm{~cm}^{3} of 0.0100 moldm30.0100 \mathrm{~mol} \mathrm{dm}{ }^{-3} sodium thiosulfate (Na2 S2O3)\left(\mathrm{Na}_{2} \mathrm{~S}_{2} \mathrm{O}_{3}\right)50.0±0.1 cm350.0 \pm 0.1 \mathrm{~cm}^{3} of water with 0.0200±0.0001 g0.0200 \pm 0.0001 \mathrm{~g} of potassium iodide (KI) dissolved in it.
After 45 seconds this mixture suddenly changed from colourless to blue-black.

Question 1(e)

(a)

The colour change occurs when 1.00×10⁴ mol1.00 \times 10^{-4} \mathrm{~mol} of iodine has been formed. Use the total volume of the solution and the time taken, to calculate the rate of the reaction, including appropriate units.

[ 4 ]

Question 1(f)

(b)

The activation energy can be determined using the Arrhenius equation, which is given in Table 1 of the Data Booklet. The experiment was carried out at five different temperatures. An incomplete graph to determine the activation energy of the reaction, based on these results, is shown below.

Question image
[ 5 ]

Question 1(f)(i)

(i)

State the labels for each axis.

x-axis:
y-axis:

[ 2 ]

Question 1(f)(ii)

(ii)

Use the graph to determine the activation energy of the reaction, in kJmol1\mathrm{kJ} \mathrm{mol}^{-1}, correct to three significant figures.

[ 3 ]

Question 1(g)

(c)

In another experiment, 0.100 g of a black powder was also added while all other concentrations and volumes remained unchanged. The time taken for the solution to change colour was now 20 seconds. Outline why you think the colour change occurred more rapidly and how you could confirm your hypothesis.

[ 2 ]

Question 1

[Maximum number: 2]

This question is about a mug made of a lead alloy.

Question image

The rate of lead dissolving in common beverages with various pH values was analysed.

Lead dissolving in beverages at various times and temperatures

Lead dissolving in beverages at various times and temperatures

Question 1(a)

(a)

Identify the experiment with the highest rate of lead dissolving.

[ 1 ]

Question 1(b)

Question 1(b)(ii)

(b)
(i)

Examine, giving a reason, whether the rate of lead dissolving increases with acidity at 18C18^{\circ} \mathrm{C}.

[ 1 ]

Question 1

[Maximum number: 8]

The rate of the acid-catalysed iodination of propanone can be followed by measuring how the concentration of iodine changes with time.

I2(aq)+CH3COCH3(aq)CH3COCH2I(aq)+H+(aq)+I(aq)\mathrm{I}_{2}(\mathrm{aq})+\mathrm{CH}_{3} \mathrm{COCH}_{3}(\mathrm{aq}) \rightarrow \mathrm{CH}_{3} \mathrm{COCH}_{2} \mathrm{I}(\mathrm{aq})+\mathrm{H}^{+}(\mathrm{aq})+\mathrm{I}^{-}(\mathrm{aq})

The general form of the rate equation is:

 Rate =[H3CCOCH3(aq)]m×[I2(aq)]n×[H+(aq)]p\text { Rate }=\left[\mathrm{H}_{3} \mathrm{CCOCH}_{3}(\mathrm{aq})\right]^{\mathrm{m}} \times\left[\mathrm{I}_{2}(\mathrm{aq})\right]^{\mathrm{n}} \times\left[\mathrm{H}^{+}(\mathrm{aq})\right]^{\mathrm{p}}

The reaction is first order with respect to propanone.

Question 1(a)

Question 1(a)(ii)

(a)
(i)

A student produced these results with [H+]=0.15 moldm3\left[\mathrm{H}^{+}\right]=0.15 \mathrm{~mol} \mathrm{dm}^{-3}. Propanone and acid were in excess and iodine was the limiting reagent.

Determine the relative rate of reaction when [H+]=0.15 moldm3\left[\mathrm{H}^{+}\right]=0.15 \mathrm{~mol} \mathrm{dm}^{-3}.

Question image
[ 2 ]

Question 1(b)

(b)

The student then carried out the experiment at other acid concentrations with all other conditions remaining unchanged.

Table

Determine the relationship between the rate of reaction and the concentration of acid and the order of reaction with respect to hydrogen ions.

Relationship:

Order of reaction with respect to [H+]\left[\mathrm{H}^{+}\right]:

[ 2 ]

Question 1(c)

(c)

When the concentration of iodine is varied, while keeping the concentrations of acid and propanone constant, the following graphs are obtained.

Question image

Deduce, giving your reason, the order of reaction with respect to iodine.

Order with respect to iodine:

Reason:

[ 2 ]

Question 1(d)

(d)

When the reaction is carried out in the absence of acid the following graph is obtained.

Question image

Discuss the shape of the graph between A and B.

[ 2 ]

Question 1

[Maximum number: 2]

A student investigated the effect of concentration on the rate of reaction between sodium thiosulfate, Na2 S2O3\mathrm{Na}_{2} \mathrm{~S}_{2} \mathrm{O}_{3}, and hydrochloric acid, HCl .

Na2 S2O3(aq)+2HCl(aq)S( s)+2NaCl(aq)+SO2( g)+H2O(l)\mathrm{Na}_{2} \mathrm{~S}_{2} \mathrm{O}_{3}(\mathrm{aq})+2 \mathrm{HCl}(\mathrm{aq}) \rightarrow \mathrm{S}(\mathrm{~s})+2 \mathrm{NaCl}(\mathrm{aq})+\mathrm{SO}_{2}(\mathrm{~g})+\mathrm{H}_{2} \mathrm{O}(\mathrm{l})

Since the solid sulfur product is insoluble, the rate can be determined by measuring the time it takes for the clear solution to turn off-white or pale yellow until the X mark on a white tile below the flask can no longer be seen.

Question image

Question 1(d)

(a)

The student recorded the following data.

Table

The solutions of sodium thiosulfate were in fact, all made as accurately as possible from the solid sodium thiosulfate by weighing the appropriate mass with a balance that can measure to one hundredth of a gram ( ±0.01 g\pm 0.01 \mathrm{~g} ), rather than by dilution of a stock solution.

[ 2 ]

Question 1(d)(ii)

(i)

Estimate the rate of the reaction for 0.1500 moldm30.1500 \mathrm{~mol} \mathrm{dm}^{-3}, giving the correct units.

[ 2 ]

Question 1

[Maximum number: 4]

3.26 g of iron powder are added to 80.0 cm380.0 \mathrm{~cm}^{3} of 0.200 moldm30.200 \mathrm{~mol} \mathrm{dm}^{-3} copper(II) sulfate solution. The following reaction occurs:

Fe( s)+CuSO4(aq)FeSO4(aq)+Cu( s)\mathrm{Fe}(\mathrm{~s})+\mathrm{CuSO}_{4}(\mathrm{aq}) \rightarrow \mathrm{FeSO}_{4}(\mathrm{aq})+\mathrm{Cu}(\mathrm{~s})

Question 1(c)

Question 1(c)(ii)

(a)
(i)

Outline how the initial rate of reaction can be determined from the graph in part (c)(i).

[ 2 ]

Question 1(c)(iii)

(ii)

Explain, using the collision theory, why replacing the iron powder with a piece of iron of the same mass slows down the rate of the reaction.

[ 2 ]

Question 1

[Maximum number: 5]

Hydrogen peroxide decomposes to form water and oxygen.

2H2O2(aq)2H2O(l)+O2( g)2 \mathrm{H}_{2} \mathrm{O}_{2}(\mathrm{aq}) \rightarrow 2 \mathrm{H}_{2} \mathrm{O}(\mathrm{l})+\mathrm{O}_{2}(\mathrm{~g})

The reaction is catalysed by solid manganese (IV) oxide, MnO2( s)\mathrm{MnO}_{2}(\mathrm{~s}).
A student carried out a series of experiments to determine how the rate of decomposition depends on the mass of catalyst. Each time a different mass of MnO2\mathrm{MnO}_{2} was added to 25.0 cm325.0 \mathrm{~cm}^{3} of hydrogen peroxide solution. The oxygen was collected in a graduated gas syringe and the volume recorded at regular intervals.

Figure 1

Figure 1

Question 1(b)

(a)

The student hypothesized, based on underlying theory, that doubling the mass of MnO2\mathrm{MnO}_{2} would double the rate of the catalysed reaction.

[ 2 ]

Question 1(b)(ii)

(i)

Explain how the student's hypothesis might be supported by collision theory.

[ 2 ]

Question 1(c)

(b)

The results from Figure 1 were processed to produce a graph showing how the initial rate varied with the mass of catalyst.

Figure 2

Figure 2

[ 3 ]

Question 1(c)(i)

(i)

Outline how the y-axis values on Figure 2 were obtained from the results in Figure 1.

[ 2 ]

Question 1(c)(ii)

(ii)

Suggest, giving a reason, whether a best-fit line for Figure 2 should pass through the origin.

[ 1 ]

Question 1

[Maximum number: 2]

Pasteurization is used to eliminate pathogenic bacteria. The concentration of vitamin C was monitored over a period of time in pasteurized and unpasteurized orange juice.

Question image

Question 1(a)

Question 1(a)(iii)

(a)
(i)

Calculate the average rate of decrease of vitamin C concentration for pasteurized juice, in μgcm3\mu \mathrm{g} \mathrm{cm}^{-3} day 1^{-1}, for the first 56 days.

[ 1 ]

Question 1(a)(iv)

(ii)

Deduce, referring to the graph, whether pasteurization affects the rate of change of vitamin C concentration during storage of orange juice.

[ 1 ]
0 selected