EduNinja

IB Biology SLD3.3 HomeostasisQuestion Bank

Question 1

[Maximum number: 10]

Skeletal muscle fibres normally respond to insulin by absorbing glucose. Failure of skeletal muscle to respond to insulin is a major factor in the development of type II diabetes.

Question 1(a)

(a)

Distinguish between type I and type II diabetes.

[ 2 ]

Question 1(b)

(b)

A study was undertaken to investigate the effect of plasma lipids on the process of glucose absorption in response to insulin by muscle fibers. Muscle was bathed in a lipid solution for 5 hours. The lipid was then washed out over the next 3 hours. The graph shows the level of plasma fatty acids and the activity of an enzyme involved in glucose absorption in response to insulin over the period of the study. (Values are means ± standard error)

Question image

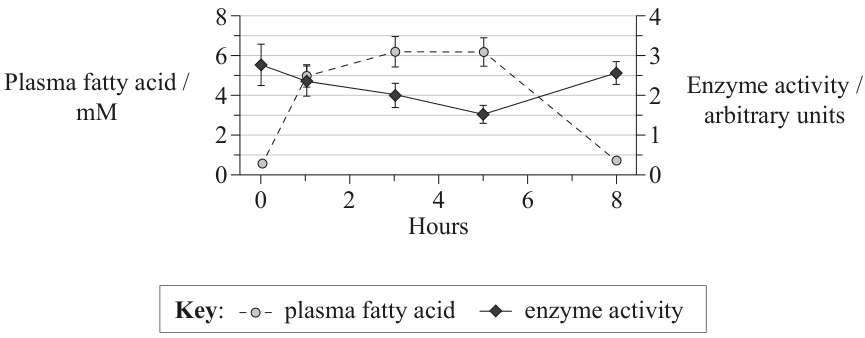
State the relationship between plasma fatty acid level and enzyme activity.

[ 1 ]

Question 1(d)

(c)

Discuss, using the data, whether the effect of lipids on this enzyme is reversible.

[ 2 ]

Question 1(e)

(d)

A further study was undertaken to look at the effect of increasing the concentration of insulin on glucose absorption in muscle bathed in lipids. A wide range of insulin concentrations were used in the same type of muscle. Glucose absorption was then measured after 5 hours.

Question image

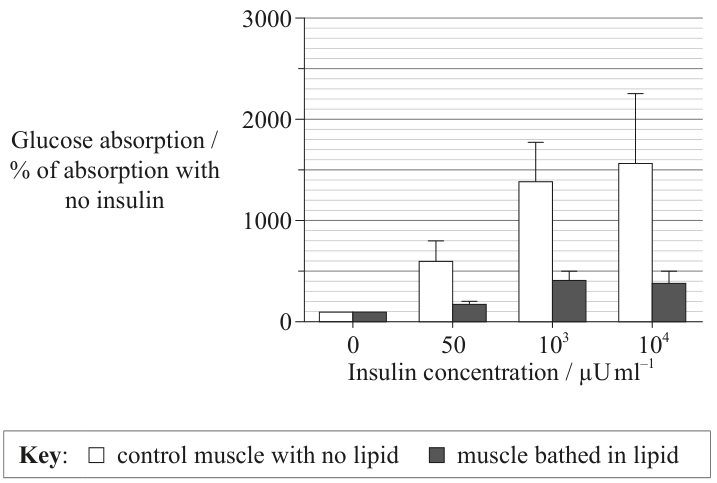
Calculate the increase in glucose absorption when insulin is increased from 0 to 103μUml110^{3} \mu \mathrm{Uml}^{-1} for the muscle bathed in lipid.
\% of absorption with no insulin

[ 1 ]

Question 1(f)

(e)

Comment on the effect of increased insulin concentration on glucose absorption in the muscle bathed in lipid.

[ 2 ]

Question 1(g)

(f)

Some investigators suggest that there is a strong relationship between high lipid diet and the body's response to insulin. Using the data provided, evaluate this hypothesis.

[ 2 ]

Question 1

[Maximum number: 2]

A nomogram can be used to determine the body mass index (BMI) of an individual.

Table

Question 1(b)

(a)

Explain how measurement of BMI could help to assess whether a person has an increased risk of type II diabetes.

[ 2 ]

Question 1

[Maximum number: 4]

A study was conducted to look at the short-term effects of a change in diet on the risk of disease in young adults. The table shows data on the habitual diet of the participants as well as the study diet followed for two weeks.

Mean daily intake ± standard deviation
Habitual dietStudy diet
Energy / kJ10143±94910143 \pm 9499992±4799992 \pm 479
Fat / g100±6100 \pm 699±599 \pm 5
Saturated fat / \% total fat37±237 \pm 260±160 \pm 1
Unsaturated fat / \% total fat63±263 \pm 240±140 \pm 1
Monounsaturated fat / \% total fat46±146 \pm 132±132 \pm 1
Polyunsaturated fat / \% total fat17±117 \pm 18±18 \pm 1
Carbohydrate / g248±23248 \pm 23232±16232 \pm 16
Protein / g119±12119 \pm 12120±9120 \pm 9

Question 1(d)

Question 1(d)(i)

(a)
(i)

Control of blood glucose concentration was investigated using an oral glucose tolerance test. For this test, the person was given a concentrated glucose drink (at time zero) and then blood samples were taken every 15 minutes to determine the plasma insulin level. This test was done before the study diet and after two weeks on the study diet. Mean results are shown in the graph, including the standard deviation.

Question image

Compare the data for plasma insulin levels before and after the study diet.

[ 2 ]

Question 1(d)(ii)

(ii)

State which cells secrete insulin.

[ 1 ]

Question 1(d)(iii)

(iii)

Outline the reason for plasma insulin levels changing in the first 30 minutes of the test.

[ 1 ]

Question 1

[Maximum number: 4]

Obesity (excessive weight) is recognized as a global health problem and has been correlated with a large number of health issues, diseases and deaths. The increased consumption of fructose, now widely used as a sweetener, has been associated with the increase in obesity.

In a study, mice were divided into four groups. Each group was given the same amount of food and either a soft drink with a different sweetener or water.

Question image
Table

Question 1(d)

(a)

State the disease that could be caused by excessive consumption of fructose.

[ 1 ]

Question 1(h)

(b)

Using all of the data, evaluate the evidence that suggests the consumption of large amounts of fructose poses a risk to human health.

[ 3 ]

Question 1

[Maximum number: 9]

Diabetes is often associated with the failure of the β\beta (beta) cells in the pancreas, but it is unclear what actually causes this failure. FoxO1 is a protein which acts as a transcription factor to regulate the expression of genes involved in cell growth. FoxO1 also regulates increase in number and differentiation in cells such as pancreatic β\beta cells.

A study was conducted using mice lacking the gene for FoxO1 in β\beta cells (IKO) as well as normal (control) mice. Blood glucose levels after fasting were compared for four groups of mice: young ( 3 months old) male mice, young ( 3 months old) female mice, older females (who have had several pregnancies) and aging males (16-20 months).

Question image

Question 1(b)

Question 1(b)(i)

(a)
(i)

Estimate the difference between mean blood glucose levels in control and IKO older female mice.
. mgml1\mathrm{mg} \mathrm{ml}^{-1}

[ 1 ]

Question 1(b)(ii)

(ii)

Aging and having pregnancies are considered to be physiological stresses.

Deduce the effect of stress on blood glucose levels.

[ 2 ]

Question 1(c)

(b)

Outline the relationship between blood glucose levels after fasting and lack of FoxO1 in the mice studied.

[ 2 ]

Question 1(e)

(c)

State the correlation between lack of FoxO1 and pancreatic hormones in mice.

[ 1 ]

Question 1(f)

(d)

Referring to the functions of insulin and glucagon, suggest how the differences in hormone levels help to explain the blood glucose levels.

[ 3 ]

Question A1

[Maximum number: 8]

A1. Body mass index (BMI) is an important indicator of health. The relationship between a high BMI and percentage risk of developing type II diabetes was studied and the following data presented.

Question image

Question A1(a)

(a)

Describe the effect of increased BMI on the risk of developing type II diabetes.

[ 2 ]

Question A1(b)

(b)

Identify the risk of developing type II diabetes in men with a BMI of 33 kg m233 \mathrm{~kg} \mathrm{~m}^{-2}.

[ 1 ]

Question A1(c)

(c)

Determine, by indicating on the graph, the range of age-adjusted relative risk for women who are overweight but not obese.

[ 1 ]

Question A1(d)

(d)

Explain the dietary advice that should be given to a patient who has developed type II diabetes.

[ 4 ]

Question 8

[Maximum number: 1]

The chart classifies individuals according to their height and mass.

Question image

Based on the information provided, which individual is most at risk of diseases associated with the accumulation of excessive body fat?

Question image

Question 3

[Maximum number: 3]

(a) Outline the symptoms of type II diabetes.

Question 3(b)

(a)

Explain the dietary advice that should be given to a patient who has developed type II diabetes.

[ 3 ]

Question 2

Question 2(c)

(a)

Outline one aspect of how P. caudatum carries out homeostasis.

[ 2 ]

Question A3

Question A3(b)

(a)

State one symptom of type II diabetes.

[ 1 ]

Question A3(c)

(b)

Explain the dietary advice that should be given to a patient who has developed type II diabetes.

[ 3 ]
0 selected