EduNinja

IB Biology SLC4.2 Transfers of energy and matterQuestion Bank

Question 1

[Maximum number: 1]

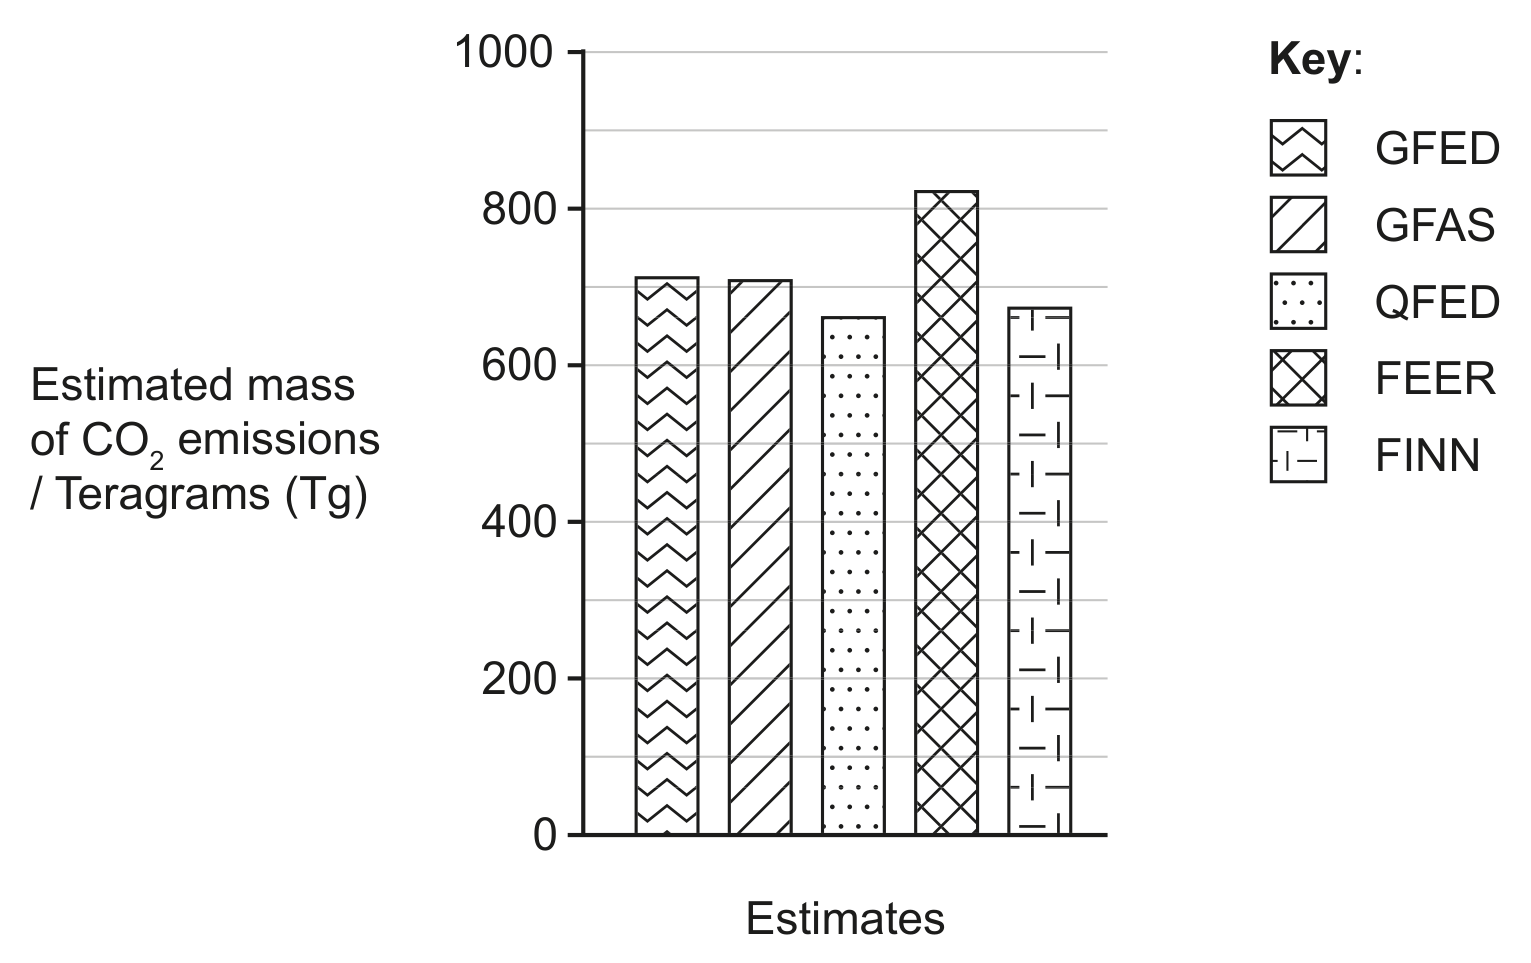
There were widespread and intense wildfires in Southeast Australia during the summer season from November 2019 to January 2020. Estimates have been made of carbon dioxide emissions from these fires based on satellite monitoring data. The bar chart shows estimates made by five different research programmes: GFED, GFAS, QFED, FEER and FINN.

Question image

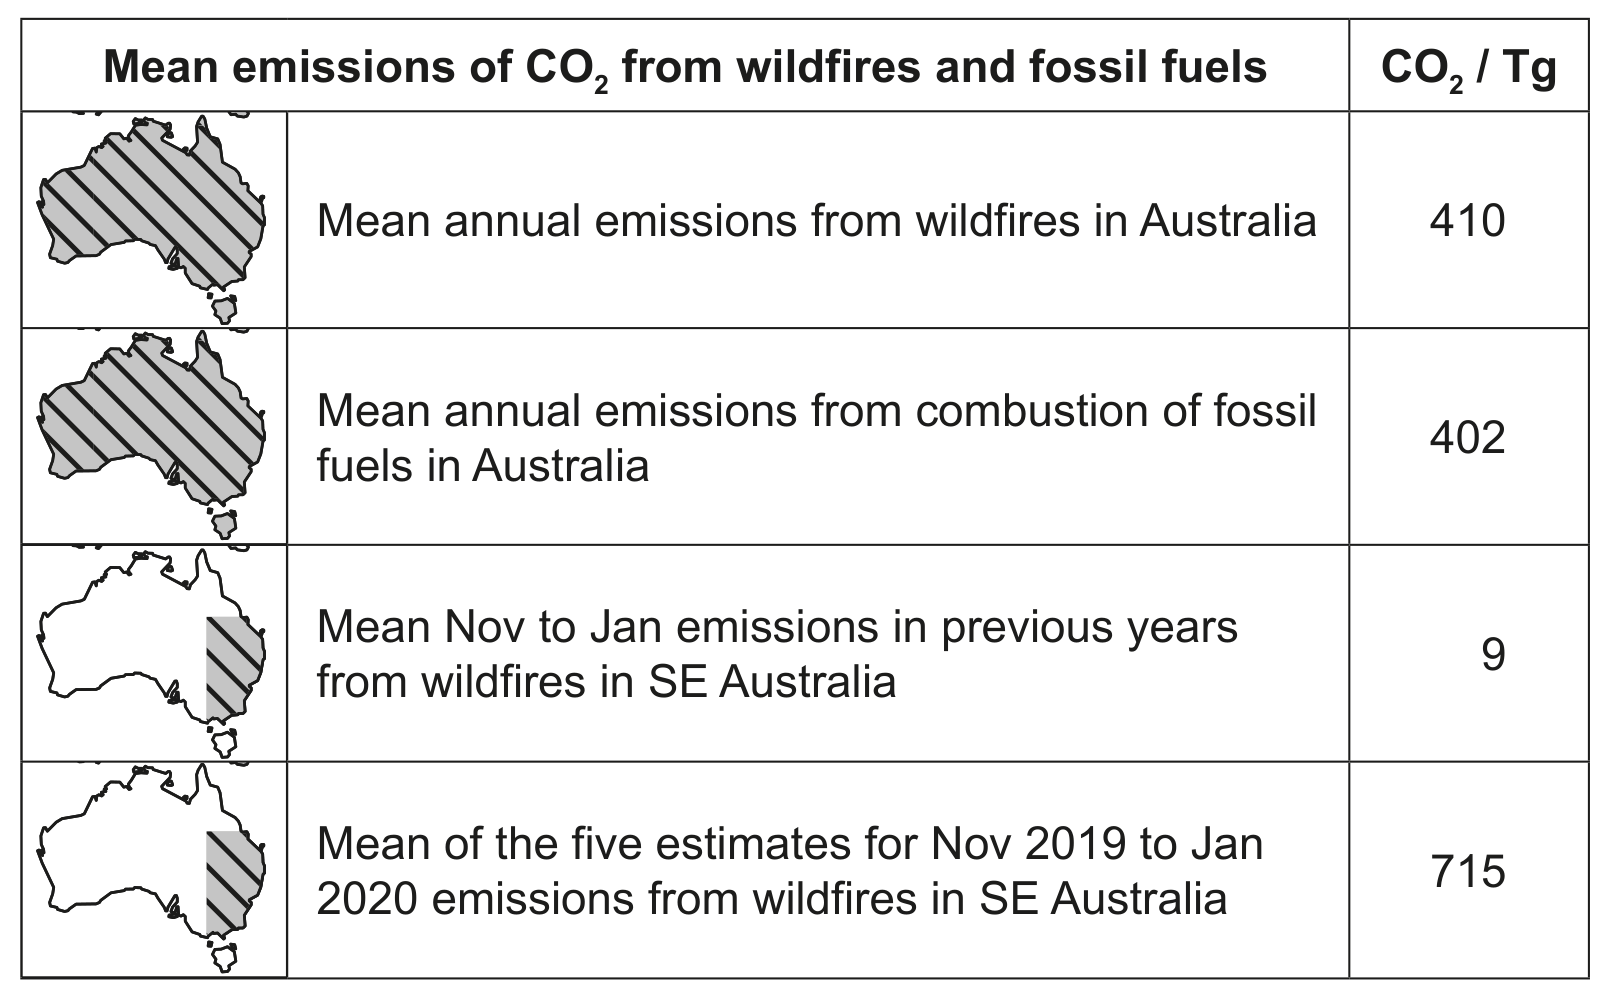
The table shows other statistics for comparison.

Table

2019-2020 constrained by satellite. Nature (597), pp. 366-369. https://doi.org/10.1038/s41586-021-03712-y.]

Question 1(a)

(a)

The highest estimate of CO2\mathrm{CO}_{2} emitted from wildfires in Southeast Australia between November 2019 and January 2020 is 820 Tg , from the FEER research programme. State the lowest estimate.

Programme:
Estimate:

[ 1 ]

Question 1

[Maximum number: 2]

Beavers are large rodents that live in waterways throughout the northern hemisphere. Dams made by beavers change the temperature of the streams and affect the mayfly, Baetis bicaudatus. In the summer of 2008, beaver ponds in West Brush Creek and Cement Creek, Colorado, were studied to evaluate their impacts on mayflies. The study sites included streams flowing into (upstream) and out of (downstream) each beaver pond.

Question image

Mayflies, including the species B. bicaudatus, are aquatic insects that hatch and spend their larval stages in water emerging from the water as adults. Larger females produce an increased number of better quality eggs.

Question 1(e)

(a)

The trout, Oncorhynchus mykiss, that live in West Brush Creek and Cement Creek also feed on the mayflies. Fishermen come to Colorado to catch and eat trout.
Draw a diagram of part of a food web for the creeks in Colorado, including mayflies, humans, trout and bats.

[ 2 ]

Question 2

[Maximum number: 2]

When feed for animals is stored, moisture levels need to be kept low to prevent the growth of fungi. Feed was exposed to 15 % moisture and placed into a respirometer. O2\mathrm{O}_{2} consumption was monitored using the respirometer over a period of six days.

Question image

Question 2(b)

(a)

Outline the role of fungi in nutrient cycling.

[ 2 ]

Question 3

[Maximum number: 3]

Growth rates of marine algae can be investigated using experimental mesocosms such as those shown.

Question image

Data are shown for percentage growth rates of red algae, grown in their natural environment and using mesocosms. The conditions investigated included competition from green algae and from elevated CO2\mathrm{CO}_{2}, as well as competition from green algae combined with elevated CO2\mathrm{CO}_{2}.

Question image

Question 3(d)

(a)

Explain how to set up a mesocosm in a sealed container. provided.

[ 3 ]

Question 2

[Maximum number: 2]

Pictured below are Louis Pasteur's original drawings of swan-necked flasks.

Fig. 25 D.

Fig. 25 D.

Question 2(d)

(a)

Explain the role of decomposers in an ecosystem.

[ 2 ]

Question 3

Question 3(c)

(a)

Explain the energy flow in a food chain.

[ 3 ]

Question 3

[Maximum number: 1]

Increasing carbon dioxide concentration in the atmosphere leads to acidification of the ocean. This in turn reduces the amount of dissolved calcium carbonate. A study was undertaken to investigate the effect of increasing the concentration of atmospheric carbon dioxide on the calcification rate of marine organisms. Calcification is the uptake of calcium into the bodies and shells of marine organisms. The study was undertaken inside Biosphere-2, a large-scale closed mesocosm. The graph shows the results of the data collection.

Question image

Question 3(b)

(a)

Distinguish between the exchange of matter and energy with the surroundings in a closed mesocosm.

[ 1 ]

Question 2

[Maximum number: 1]

The diagrams show a virus and a bacterium.

Question image
Question image

Question 2(d)

(a)

Saprotrophic organisms, such as Mucor species, are abundant in soils.

[ 1 ]

Question 2(d)(ii)

(i)

State one role of saprotrophic organisms in the ecosystem.

[ 1 ]

Question 3

[Maximum number: 5]

An example of energy flow (kJm2\left(\mathrm{kJ} \mathrm{m}^{-2}\right. year 1)\left.{ }^{-1}\right) in the North Sea is shown.

Question image

Question 3(a)

(a)

Identify the trophic level represented by C .

[ 1 ]

Question 3(b)

(b)

Sketch a pyramid of energy for the trophic levels represented by A, B, C and D.

[ 2 ]

Question 3(d)

(c)

Explain the reasons that little energy is transferred between trophic levels, apart from that transferred to X.

[ 2 ]

Question 3

Question 3(a)

(a)

Distinguish between autotrophs and heterotrophs.

[ 2 ]
0 selected