Question 1
[Maximum number: 3]
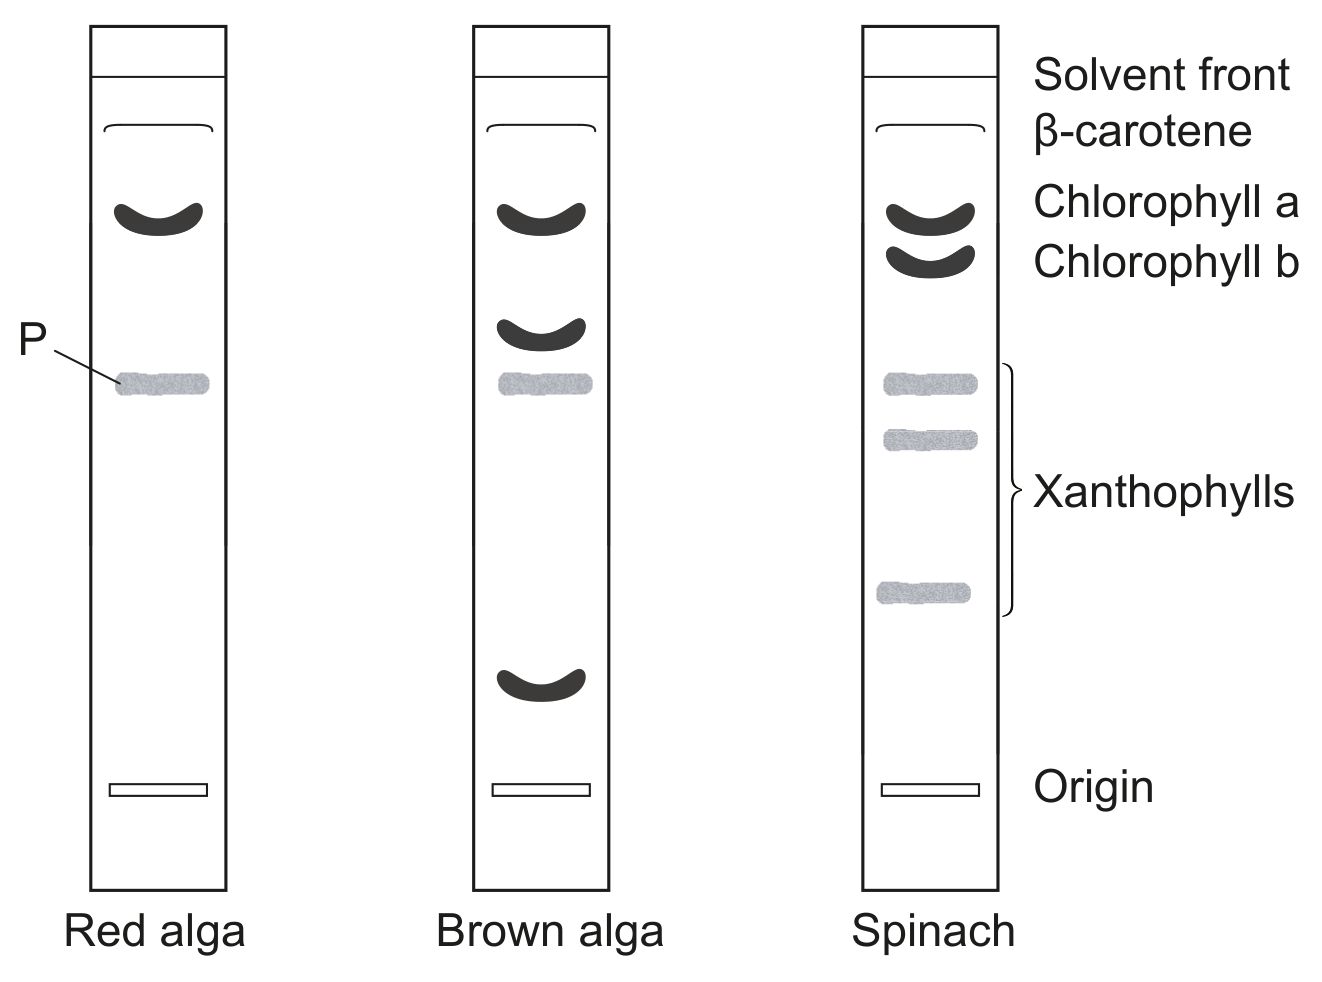
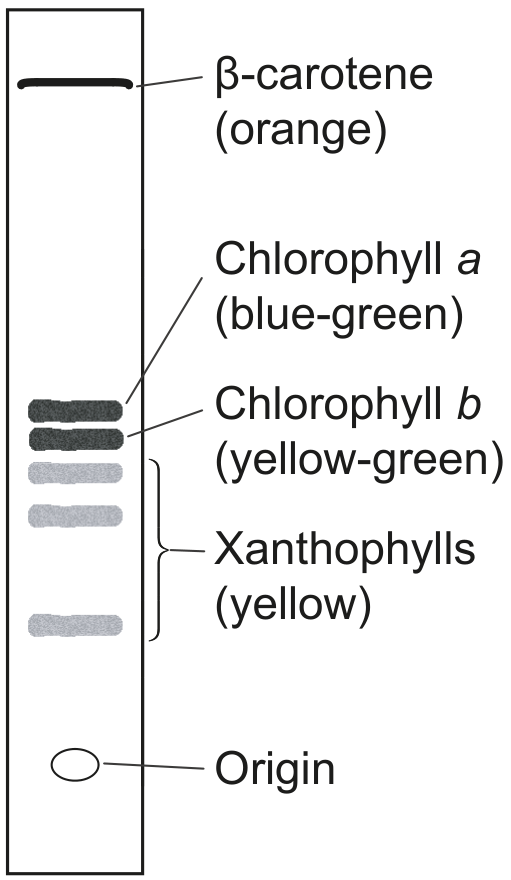
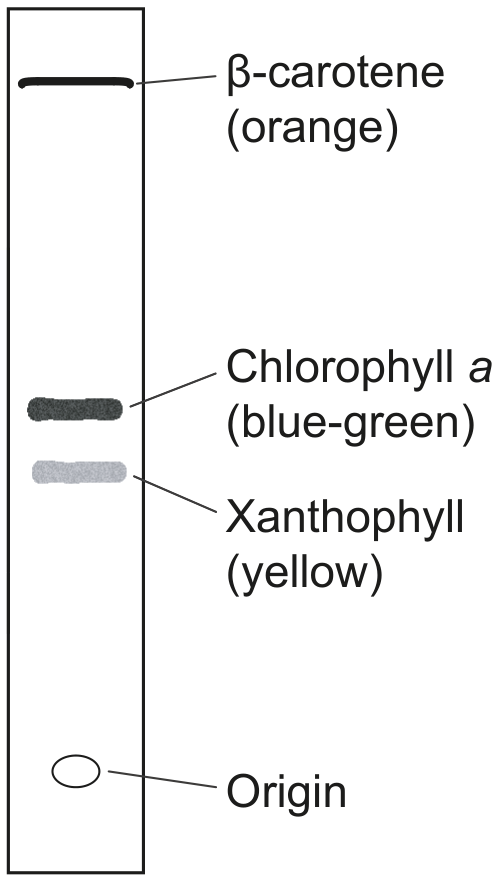
Chromatography is a technique used to separate the components of a mixture. The photosynthetic pigments from three organisms were separated by thin layer chromatography: spinach (Spinacia oleracea), a red alga (Porphyra) and a brown alga (Fucus).
Spinacia oleracea
Porphyra
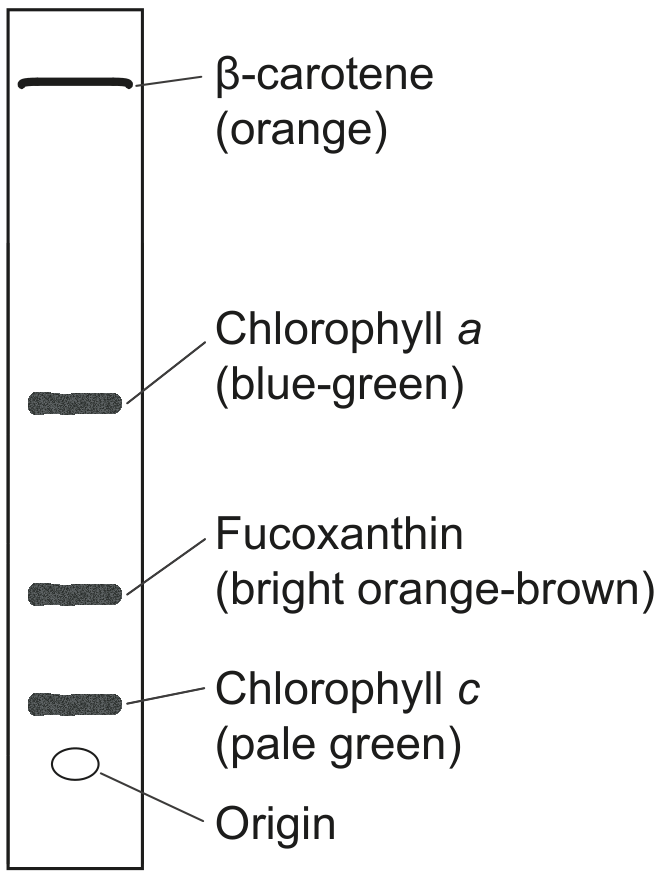
Fucus
Question 1(b)
(a)
Compare and contrast absorption spectra and action spectra.
[ 2 ]
Question 1(c)
(b)
Porphyra also contains phycoerythrin, which is a red pigment.
[ 1 ]
Question 1(c)(ii)
(i)
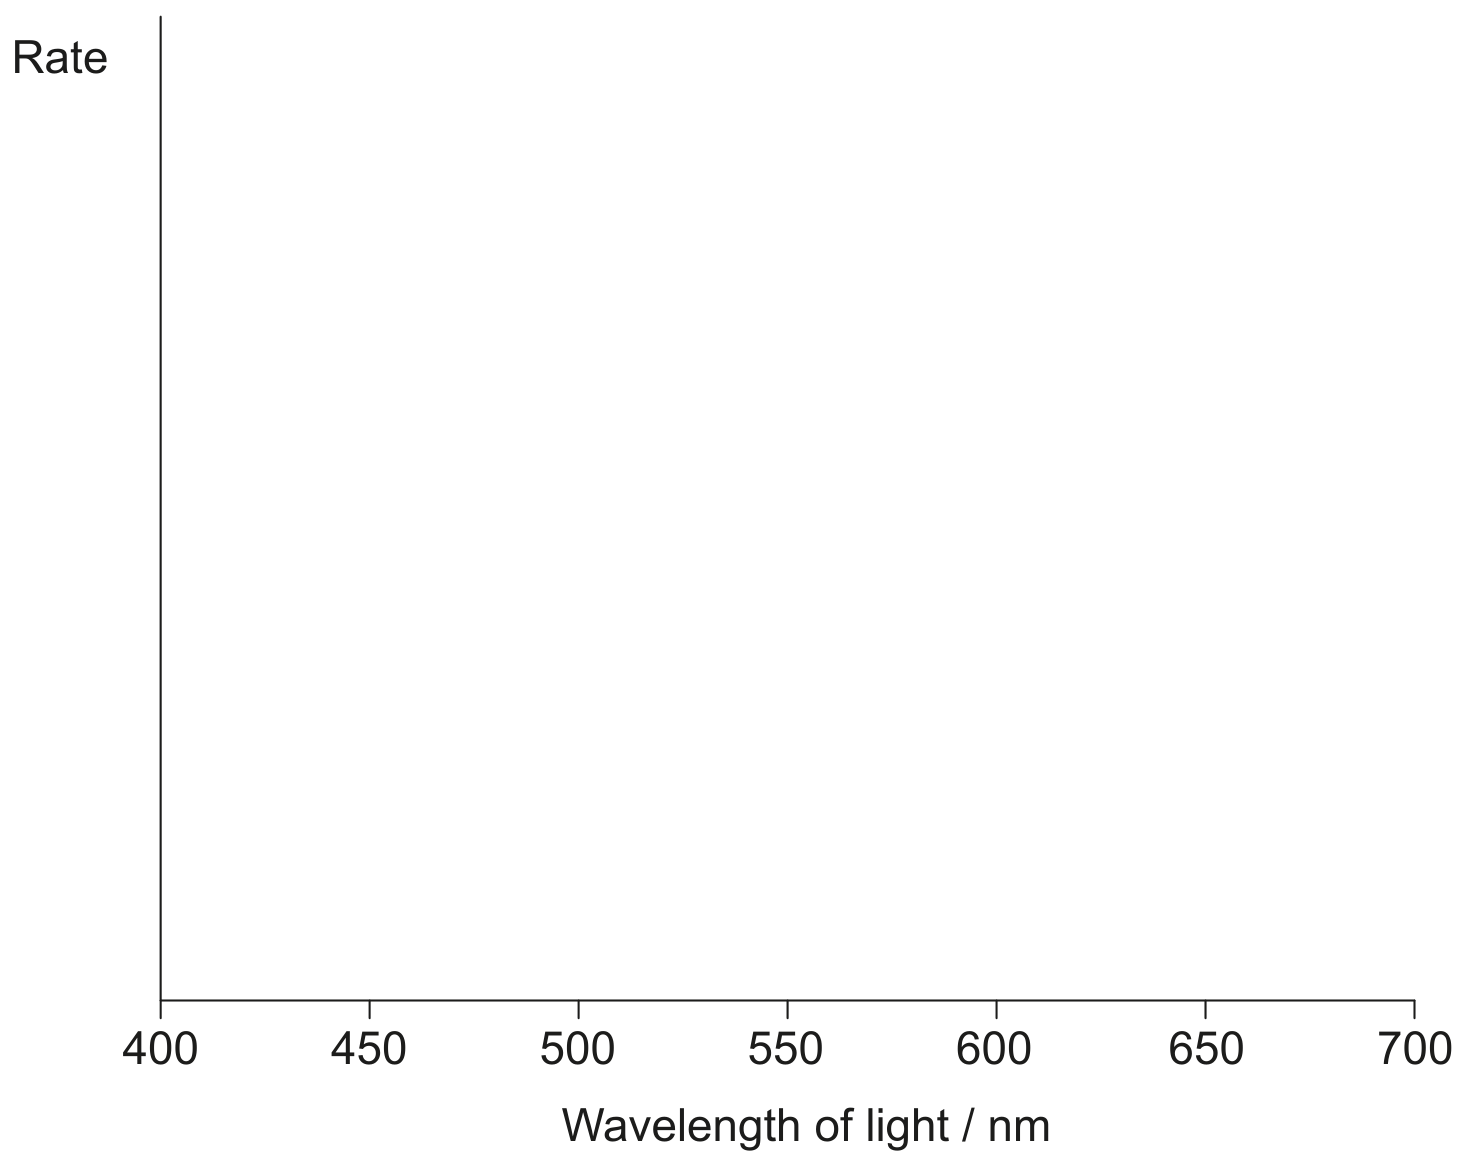
Predict one colour of light that will be absorbed efficiently by phycoerythrin.
[ 1 ]