EduNinja

IB Biology SLA4.2 Conservation of biodiversityQuestion Bank

Question 1

[Maximum number: 6]

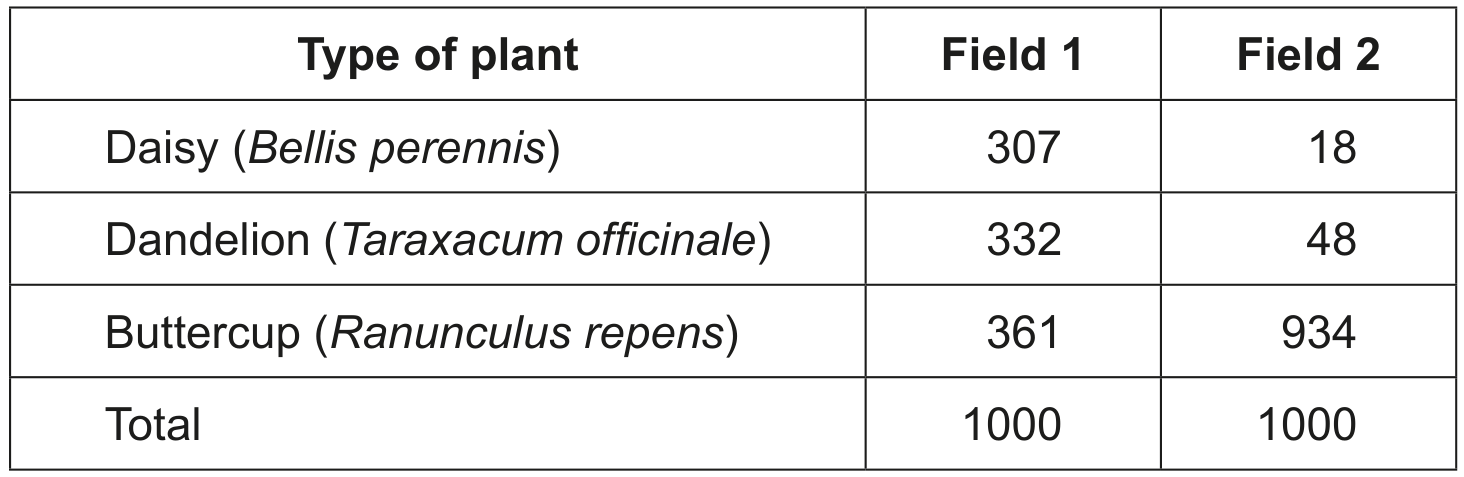
The incidence of white syndrome, an infectious disease of coral, was investigated in a six-year study on Australia's Great Barrier Reef. The map shows disease conditions on coral reefs at six study sites.

Question image

Question 1(b)

(a)

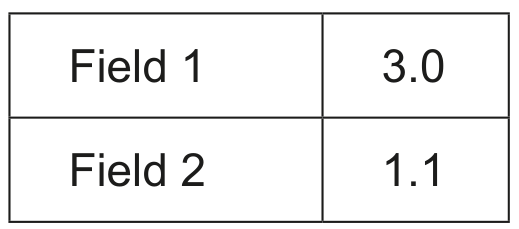
Satellites were used to record sea surface temperatures. The temperatures each week above a reef were compared with mean temperatures for that week between 1985 and 2004. If the sea surface temperature was 1C1^{\circ} \mathrm{C} or more above the mean, this was recorded as a weekly sea surface temperature anomaly (WSSTA). The number of WSSTAs was calculated for the twelve months preceding the date on which a reef was surveyed for white syndrome.

On each reef, the number of cases of white syndrome in a 1500 m21500 \mathrm{~m}^{2} sample area was surveyed once per year. The table shows these cases in relation to numbers of WSSTAs and coral cover on the reef. Low coral cover was 0-24 % and high coral cover was 50-75 %.

Question image
[ 2 ]

Question 1(b)(i)

(i)

Describe the evidence that is provided by the data in the table for the harmful effects of rising sea temperatures on corals.

[ 2 ]

Question 1(c)

(b)

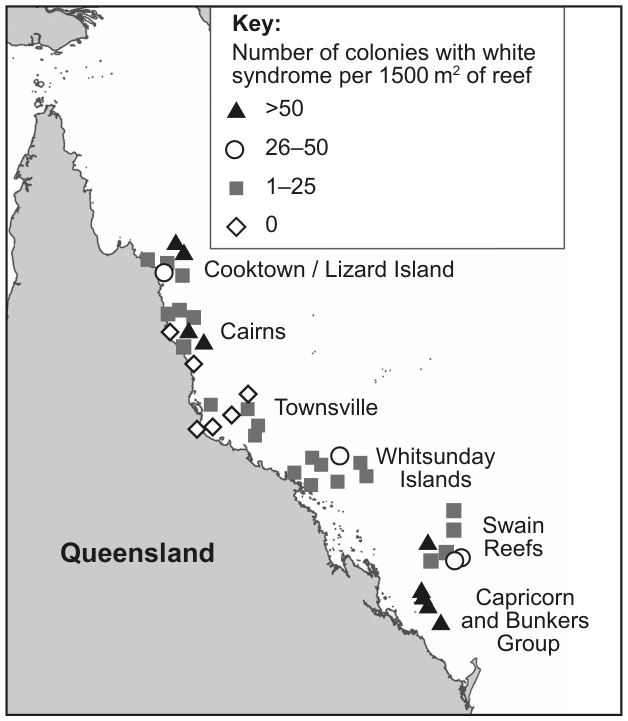
The graphs show the relationship between the weekly sea surface temperature anomalies (WSSTA) and coral cover during two twelve-month periods (1998-99 and 2002-03), which were the warmest in the six-year study. Each dot represents one studied reef.
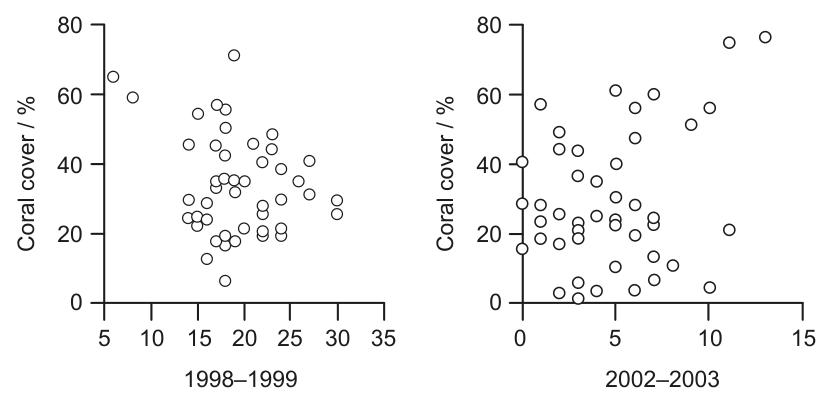
Question image
[ 1 ]

Question (ii)

(i)

Suggest a reason for the correlation between coral cover and WSSTA in 1998-1999.

[ 1 ]

Question 1(d)

(c)

Some scientists predict that, if humans continue to produce carbon dioxide at the current rate, the pH of the oceans will become more acidic. Suggest possible effects on the coral reefs.

[ 3 ]

Question 3

Question 3(a)

(a)

Describe the role of the EDGE of Existence programme.

Chimpanzees and bonobos are different species of primate. It is thought that neither species can swim. The map shows the relative locations of chimpanzees and bonobos in Africa.

Question image

Evidence suggests that the level of the Congo River was lower during one period in the past. At this time, chimpanzees could have migrated across.

[ 2 ]

Question 22

[Maximum number: 1]

The dark areas of the map show the distribution of some species included in the EDGE of Existence programme.

Question image

What is the reason these species have been included in the EDGE of Existence programme?

A

They occupy similar niches threatened by invasive species.

B

Their risk of extinction is higher as they live at the edge of ecosystems.

C

Their populations are decreasing and there are few or no closely related species.

D

They are keystone species in their ecosystems.

Question 23

[Maximum number: 1]

The North Island giant moa (Dinornis novaezealandiae) went extinct some time between the arrival of humans in New Zealand and the 1800s.

Question image

What do scientists believe to be the cause of this extinction?

A

Deforestation

B

New diseases

C

Competition with other megafauna

D

Overhunting

Question 23

[Maximum number: 1]

What are causes for a global reduction in biodiversity?

I. Increase in size of towns and cities
II. Reclamation of degraded ecosystems
III. Clearance of land for agriculture

A

I and II only

B

I and III only

C

II and III only

D

I, II and III

Question 23

[Maximum number: 1]

What could minimize the loss of biodiversity?

A

Increase the rate of deforestation

B

Introduce species into new environments to control predation

C

Reduce the use of renewable energy

D

Rewilding of degraded ecosystems

Question 6

[Maximum number: 3]

Insect pollinators are vital to maintaining the biodiversity of ecosystems, but they are threatened by some human actions. Some pollinators, such as honey bees (Apis mellifera), produce honey, which is rich in glucose.

Question 6(b)

(a)

List human actions that could threaten populations of insect pollinators such as bees.

[ 3 ]

Question 12

[Maximum number: 2]

The tundra ecosystem in Finnish Lapland has a short growing season and a mean temperature of 2.0C-2.0^{\circ} \mathrm{C}. It is also naturally grazed by herbivores such as reindeer (Rangifer tarandus). Different quadrats were set up to include and exclude the reindeer in both normal and warmed temperatures. Open-topped warming chambers were used to heat both the soil and air in the warmed quadrats. The graph shows the changes in plant richness over five years.

Question image

Question 12(a)

(a)

State what is meant by species richness.

[ 1 ]

Question 12(d)

(b)

Suggest how the results of this experiment can be used in the planning of in situ conservation programmes for tundra plant species.

[ 1 ]

Question 13

[Maximum number: 4]

The number of plants in two fields of approximately the same size was counted.

Table

Question 13(a)

(a)

Compare and contrast the richness and the evenness of the two fields.

[ 2 ]

Question 13(b)

(b)

A calculation of Simpson's reciprocal index was undertaken on each field with the following results.

Table

Evaluate these results.

[ 2 ]

Question 12

[Maximum number: 2]

Outline one example of an active management strategy employed in the context of in situ conservation.

0 selected