

EduNinja

Edexcel A-Level Physics A2 Testing Laws with Logarithmic Plots

Edexcel A-Level Physics A2 Testing Laws with Logarithmic Plots
Pearson Edexcel International Advanced Subsidiary/Advanced Level in Physics, Issue 3, July 2021Physics XPH11/YPH11

Review testing laws with logarithmic plots in Edexcel A-Level Physics through power-law gradients, exponential decay and processed log data.

How this is tested

  • transform a power-law relationship into a straight-line log plot and use its gradient
  • linearise exponential decay data so the gradient gives the decay constant or related parameter
  • process logarithmic table columns before plotting and interpreting the tested physical law

Question 3(a)

[Maximum number: 2]

A student investigated the damping of a rotational pendulum using the apparatus shown.
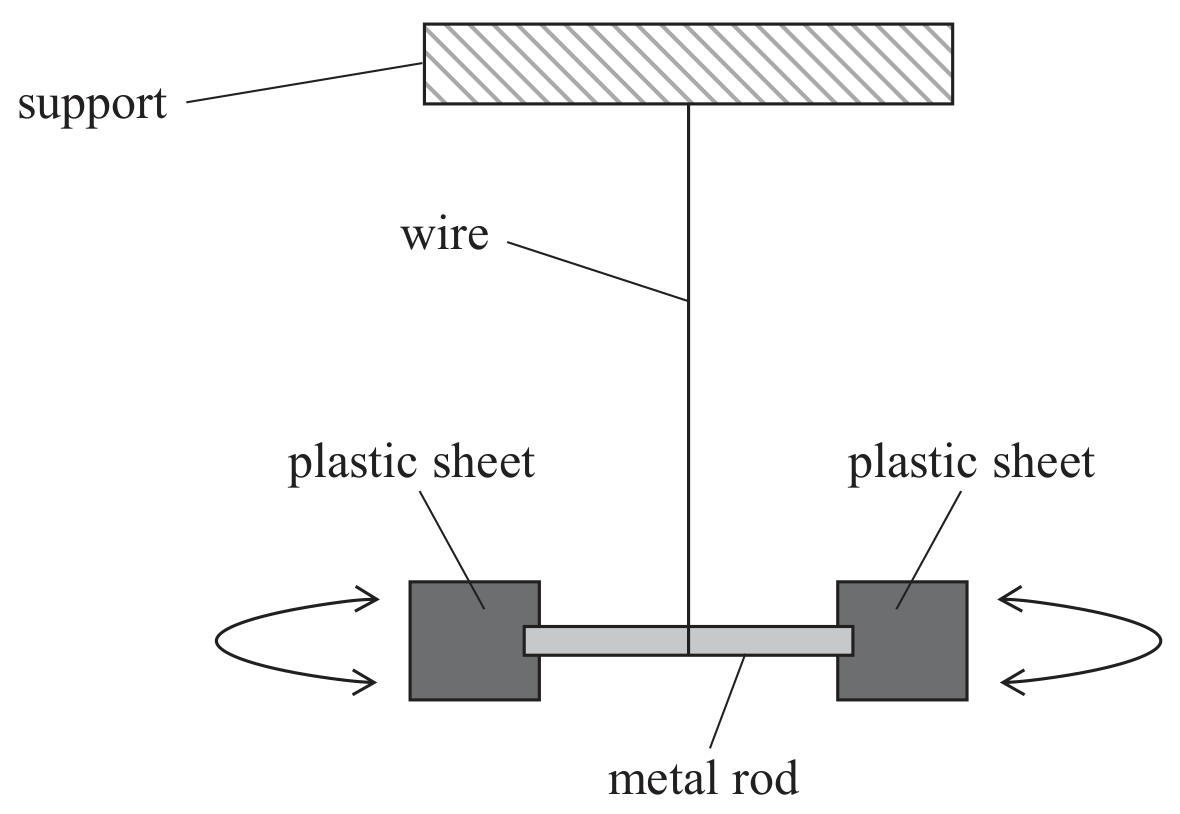
Figure for Question 3(a) — Edexcel A-Level Physics A2

When the metal rod is rotated through an angle and released, the rod performs angular oscillations about a vertical axis through the wire. The plastic sheets dampen the oscillations as they move through the air.

The relationship between the maximum displacement angle θ\theta and number of oscillations n is given by

θ=θ0eλn\theta=\theta_{0} \mathrm{e}^{-\lambda n}

where θ0\theta_{0} is the initial displacement angle and λ\lambda is a constant.
Explain why a graph of lnθ\ln \theta against n could be used to determine a value for λ\lambda.