
Haploid gametes + fusion = diploid zygote
Inheritance begins with a chromosome-number rule. Meiosis makes haploid gametes, so each gamete carries one allele for each autosomal gene. Fertilization fuses two haploid gametes to form a diploid zygote, restoring two alleles, usually one from each parent.
Order the inheritance route.
OrderGenetic crosses in flowering plants
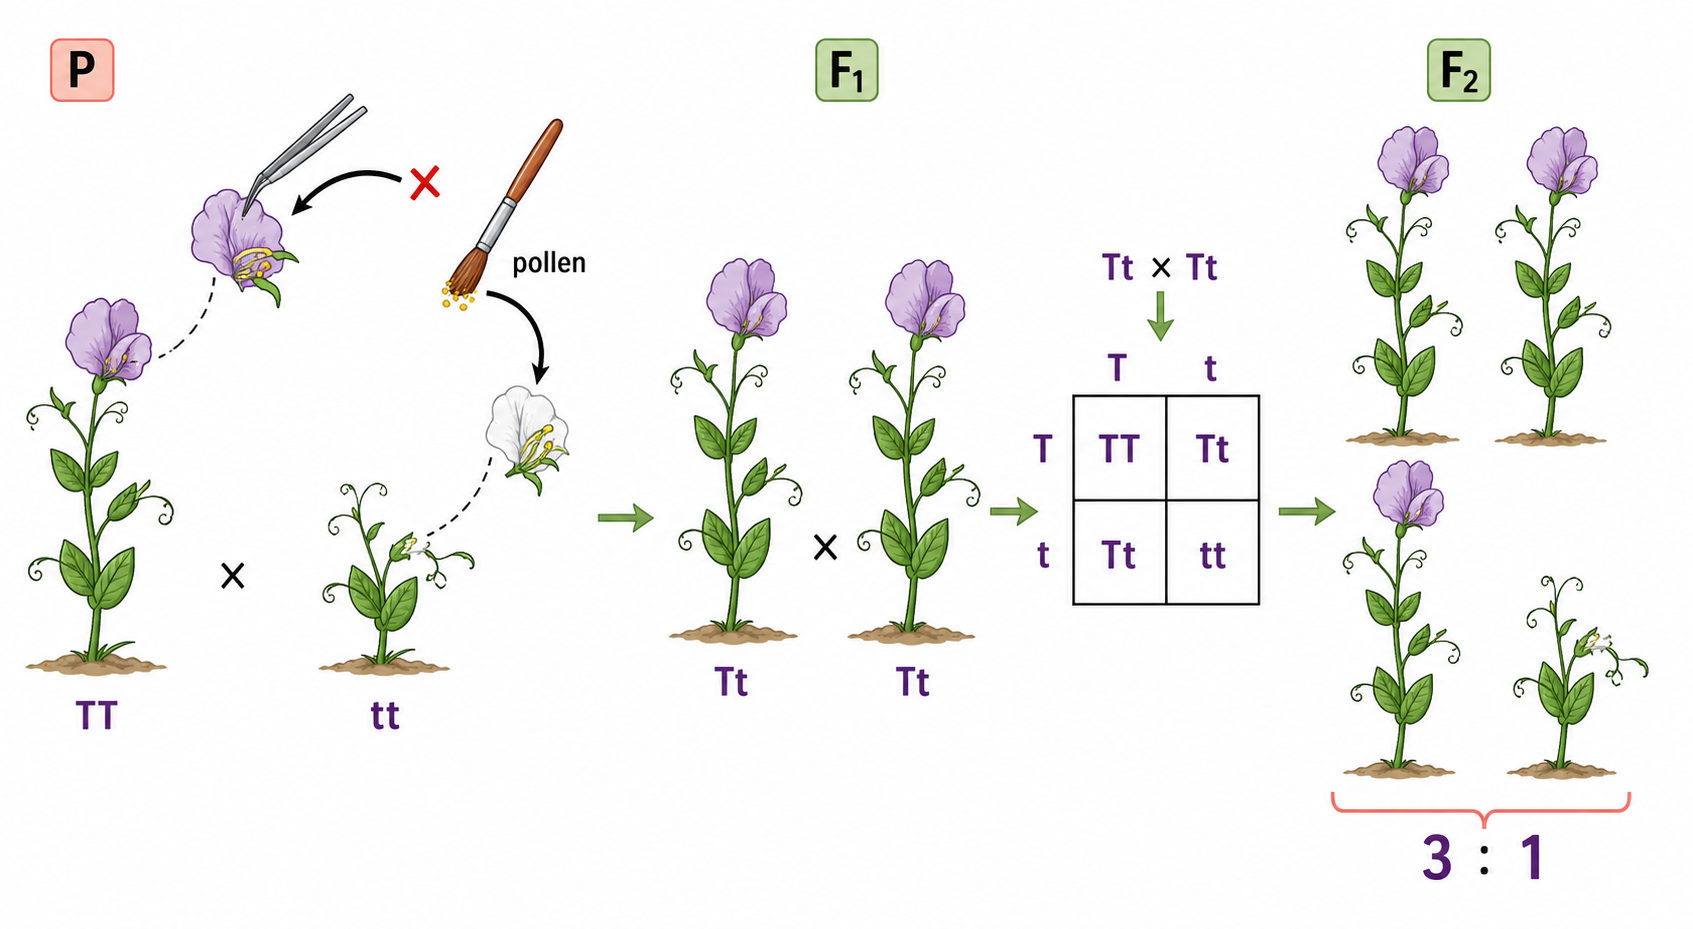
A genetic cross is a controlled fertilization experiment. In flowering plants, pollen transfer can be controlled so the parental generation is known. The F1 and F2 generations are then counted, and Punnett grids convert possible gametes into expected inheritance ratios.
Controlled pollen transfer lets geneticists connect generations to inheritance ratios.
Match each cross term to its role.
MatchMatch each cross term to its role.
ChooseGenotype
Genotype is the allele combination an organism inherits for one gene or several genes. Homozygous means the two alleles match, such as AA or aa. Heterozygous means the alleles differ, such as Aa. Keep gene, allele, and genotype separate in wording.
Sort the genotypes.
SortPhenotype
Phenotype is the observable characteristic or trait. It can be caused by genotype, environment, or an interaction between both. That is why the same genotype can sometimes show different phenotypes in different environments, and why a visible trait is not always enough to know the genotype.
Sort each example by what mainly explains the phenotype.
SortDominant and recessive alleles
Dominance is about expression in a heterozygote. A dominant allele is expressed when paired with a different recessive allele, so AA and Aa may share the dominant phenotype. A recessive phenotype appears only when no dominant allele masks it, usually aa. Dominant does not mean common or better.
Spot the error: a dominant allele must be the most common allele in the population.
Spot ErrorsPhenotypic plasticity
Phenotypic plasticity means one genotype can produce different phenotypes in different environments. The DNA sequence does not change. Instead, environmental conditions alter gene expression or development, and the response can be adaptive or reversible.
Spot the error: plasticity means the environment mutates the DNA sequence.
Spot ErrorsPhenylketonuria (PKU)
PKU is a strong genotype-environment example. The disorder is autosomal recessive and affects phenylalanine metabolism. Newborn screening matters because a low-phenylalanine diet can reduce harmful effects even when the recessive genotype is present.
Which explanation best links PKU genotype to treatment?
ChooseSNPs and multiple alleles
A single nucleotide polymorphism, or SNP, is a single-base difference that can create a different allele. Populations can contain many alleles of the same gene, but a diploid individual still carries at most two alleles at that autosomal locus.
Spot the error: because a gene has multiple alleles, each diploid individual carries all of them.
Spot ErrorsABO blood groups
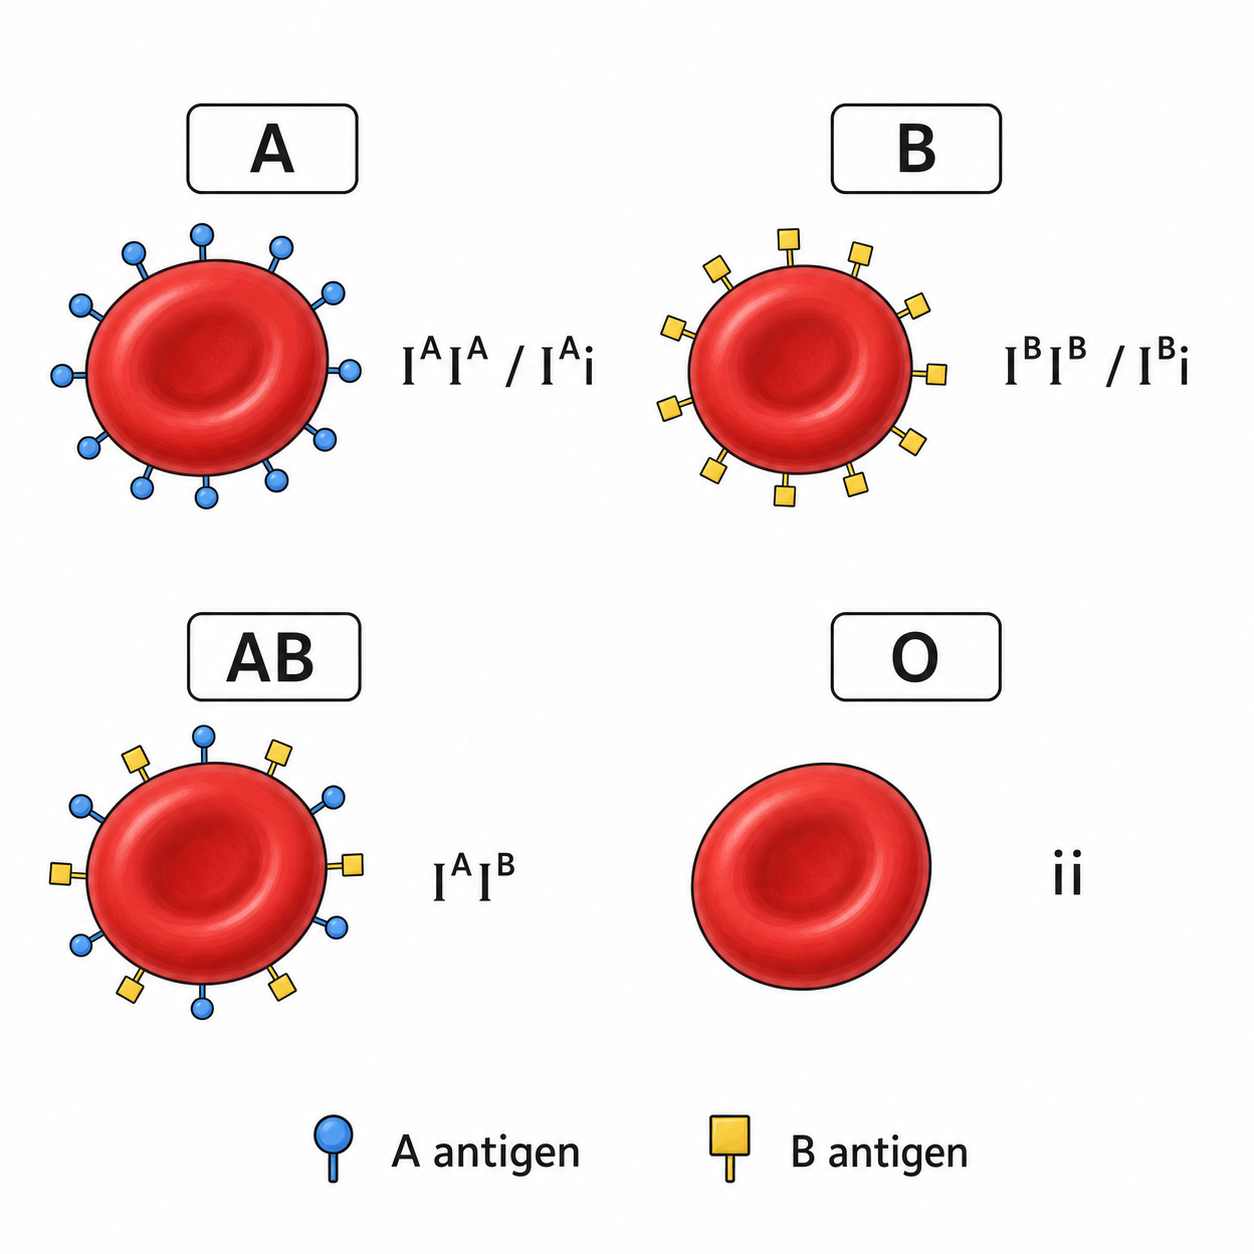
ABO blood group is controlled by three alleles in the population: IA, IB, and i. IA and IB are codominant, so IAIB produces AB blood with both antigens. The i allele is recessive, so type O appears only as ii. Type A and type B can each be homozygous or heterozygous.
ABO inheritance combines multiple alleles with codominance.
Match each genotype to the ABO phenotype.
MatchMatch each genotype to the ABO phenotype.
ChooseIncomplete dominance and codominance
Incomplete dominance and codominance both break the simple dominant/recessive pattern. In incomplete dominance, the heterozygote has an intermediate phenotype. In codominance, both heterozygous alleles are expressed clearly, such as IA and IB in AB blood type.
Sort the heterozygote pattern.
SortSex determination
Human chromosomal sex is usually determined by the XX or XY chromosome combination. An embryo with a Y chromosome usually has the SRY/TDF region, which directs testis development. Without that signal, development usually follows the ovarian pathway.
Order the sex-determination mechanism.
OrderHaemophilia
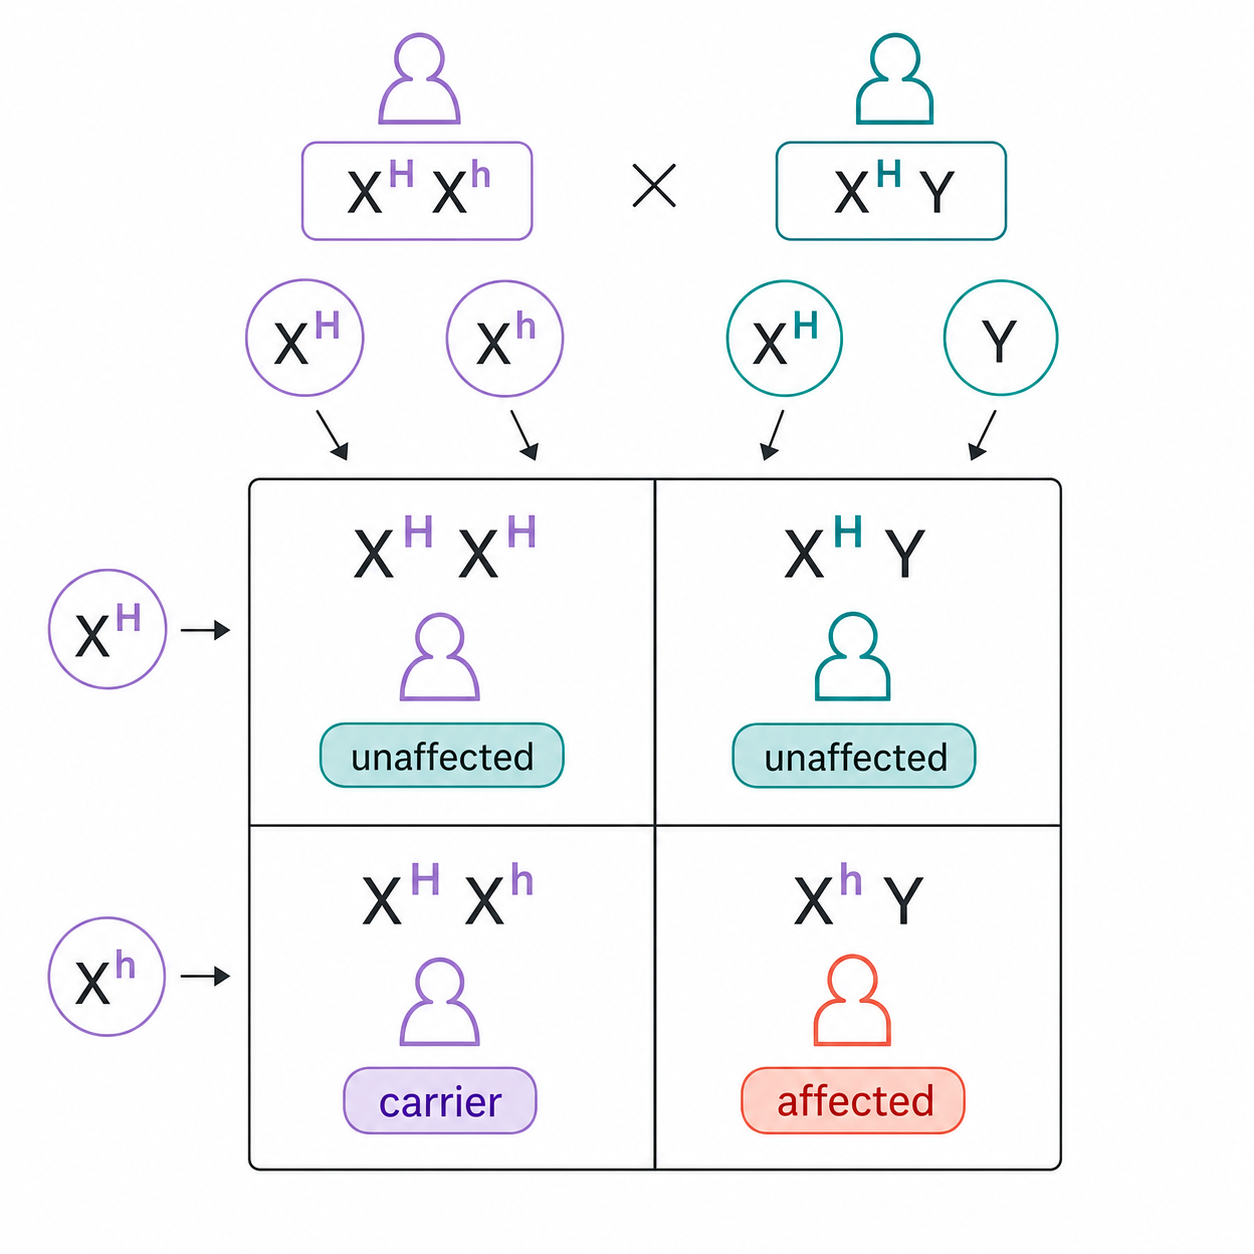
Haemophilia is an X-linked recessive blood-clotting disorder. Because males usually have only one X chromosome, a recessive allele on that X can be expressed in males. Females with one affected allele and one normal allele are carriers and are represented with X-linked allele notation.
X-linked recessive alleles are written on X chromosomes, not as plain autosomal letters.
Match the notation to the interpretation.
MatchMatch the notation to the interpretation.
ChoosePedigree charts
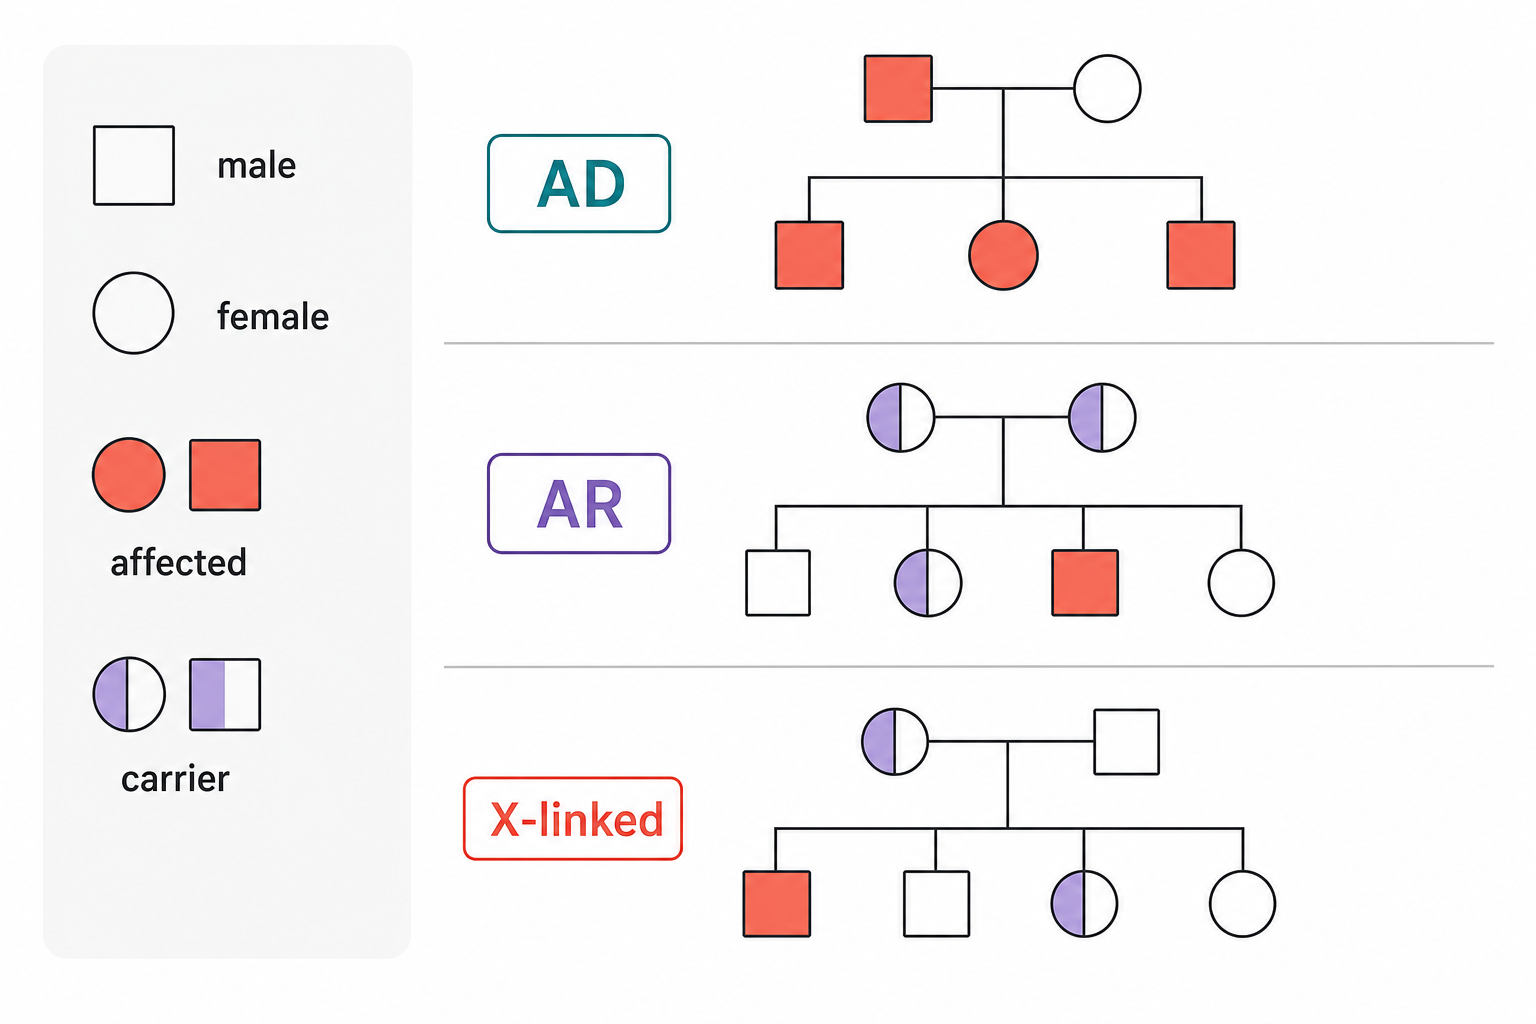
Pedigree charts show how a trait appears across generations. The pattern can help infer whether inheritance is autosomal dominant, autosomal recessive, or sex-linked. Strong answers use evidence from the chart, such as affected children from unaffected parents or sex bias among affected individuals.
Pedigree patterns let you infer inheritance mode before assigning genotypes.
A pedigree shows two unaffected parents with an affected child. Which inference is most likely?
DecisionA pedigree shows two unaffected parents with an affected child. Which inference is most likely?
ChooseContinuous variation
Continuous variation produces many intermediate phenotypes rather than clear categories. It often results from polygenic inheritance plus environmental influence. Traits such as human skin colour, height, and body mass vary continuously because many genes and environmental factors contribute.
Sort the trait type.
SortBox-and-whisker plots
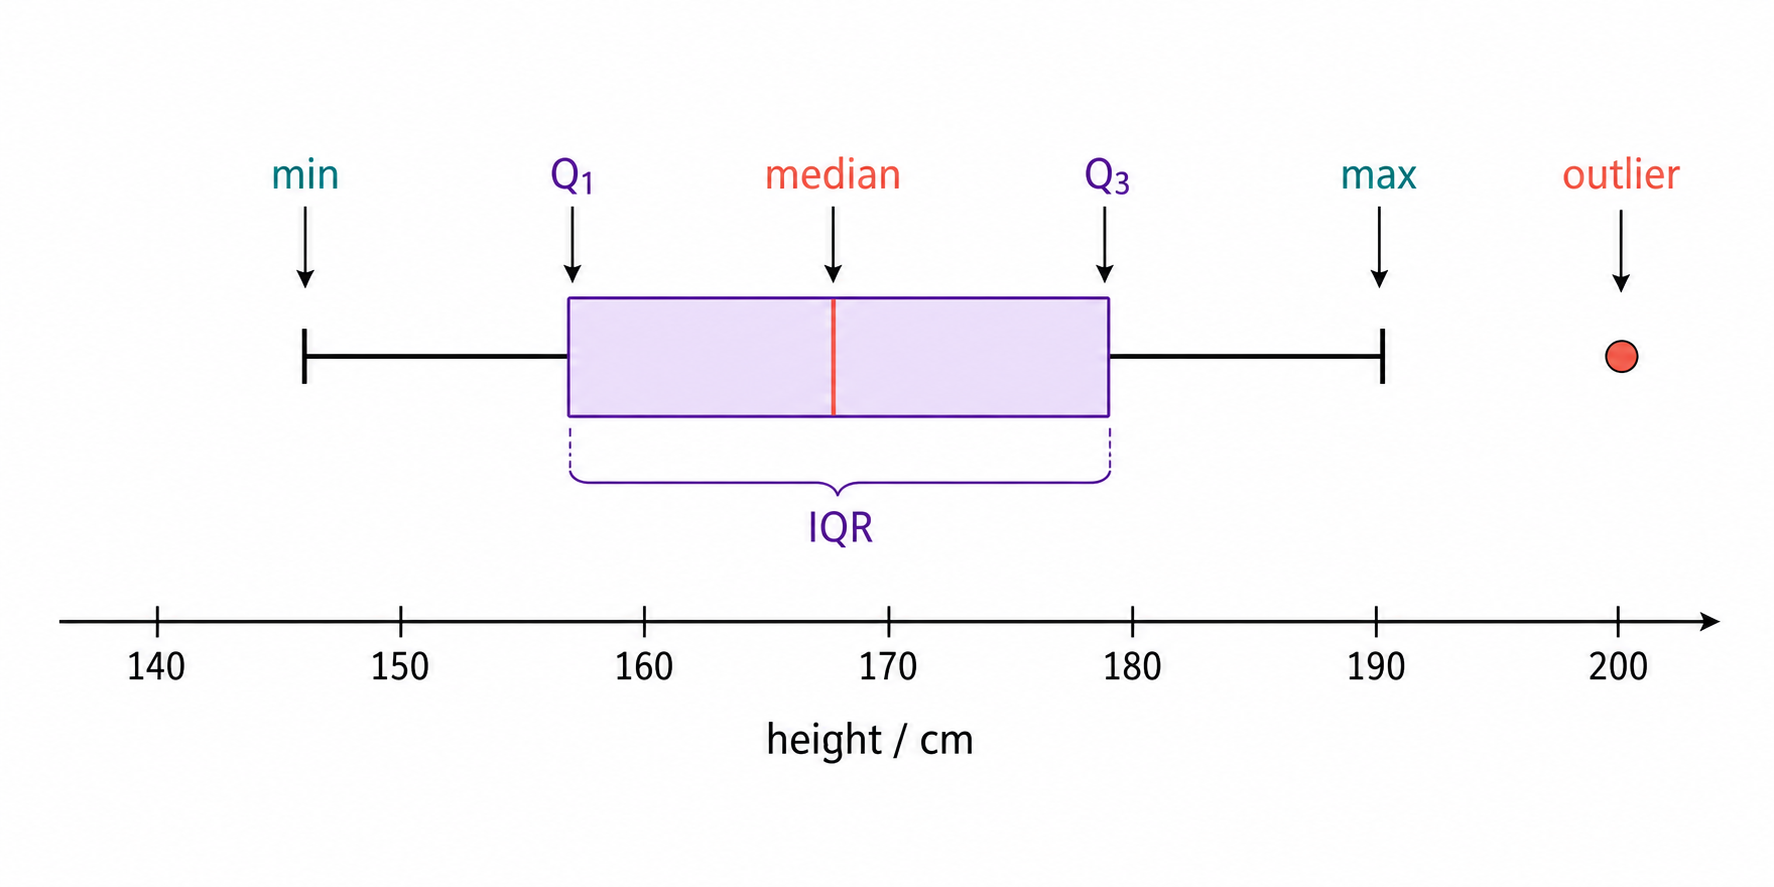
Box-and-whisker plots summarize non-normal continuous data. The median shows the middle value, quartiles split the data, and the interquartile range shows the spread of the middle 50 percent. Whiskers and outliers help compare variation between groups without assuming a normal distribution.
A box plot shows spread, median and outliers in continuous data.
Label the parts of a box-and-whisker plot.
LabelLabel the parts of a box-and-whisker plot.
ChooseSegregation and independent assortment
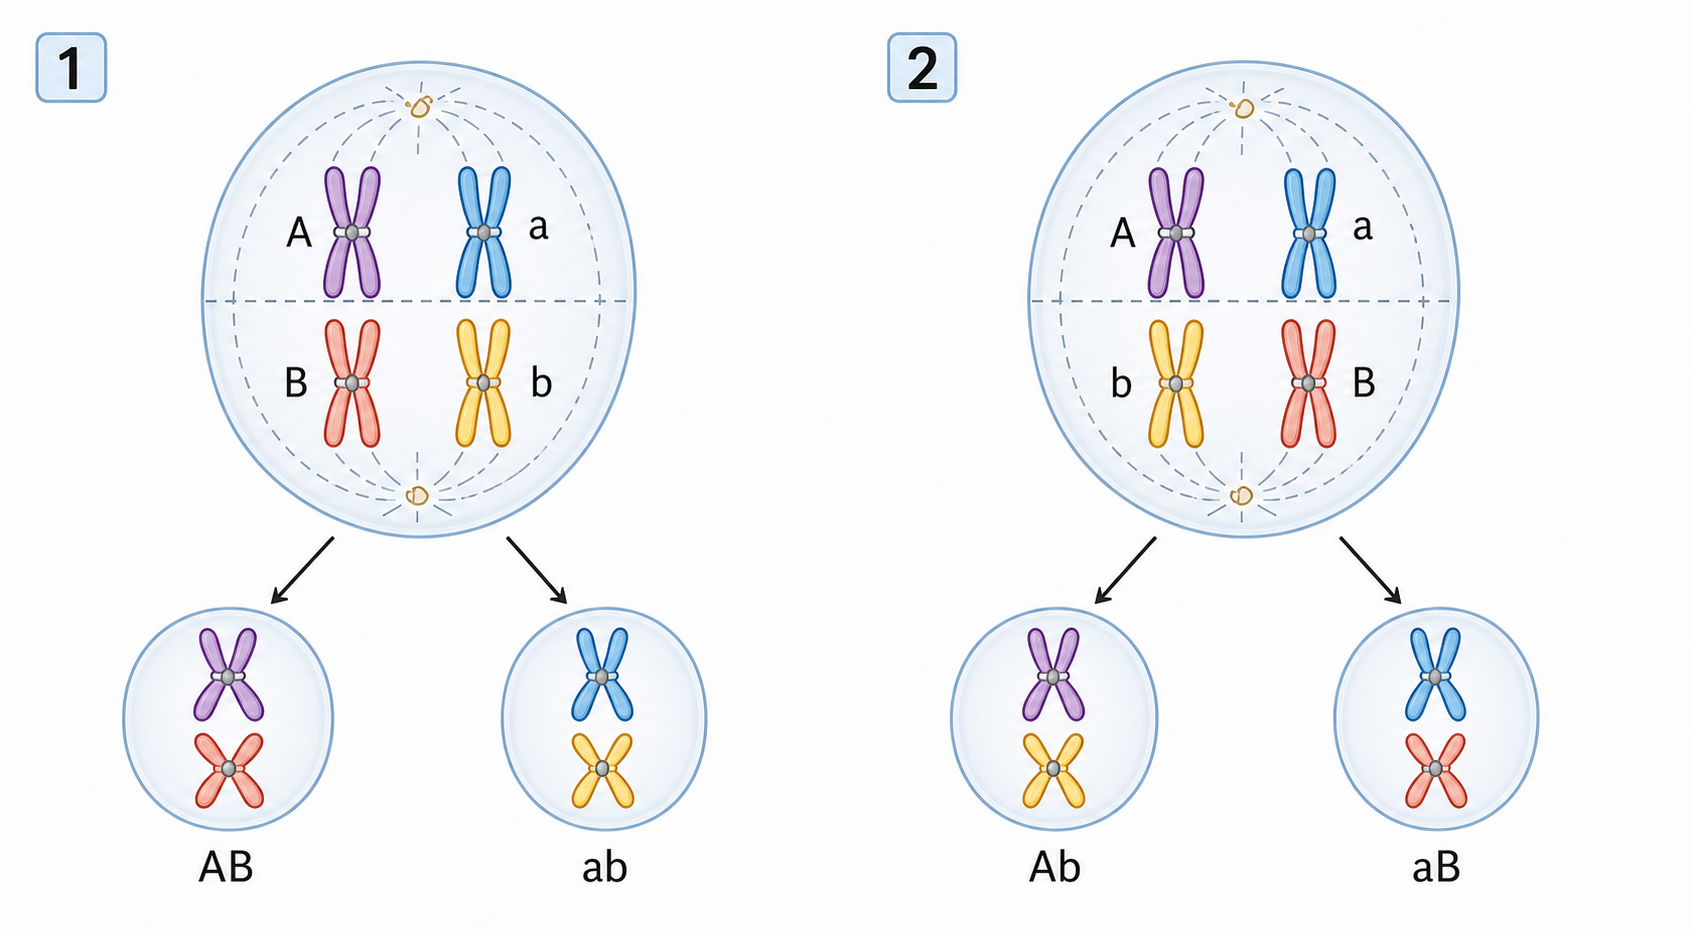
HL inheritance starts in meiosis. Alleles segregate because homologous chromosomes separate, so each gamete receives one allele from each pair. Unlinked genes assort independently because bivalents orient randomly at metaphase I, creating different chromosome combinations in gametes.
Random bivalent orientation explains independent assortment of unlinked genes.
Match the meiosis event to the inheritance rule.
MatchMatch the meiosis event to the inheritance rule.
ChooseDihybrid crosses
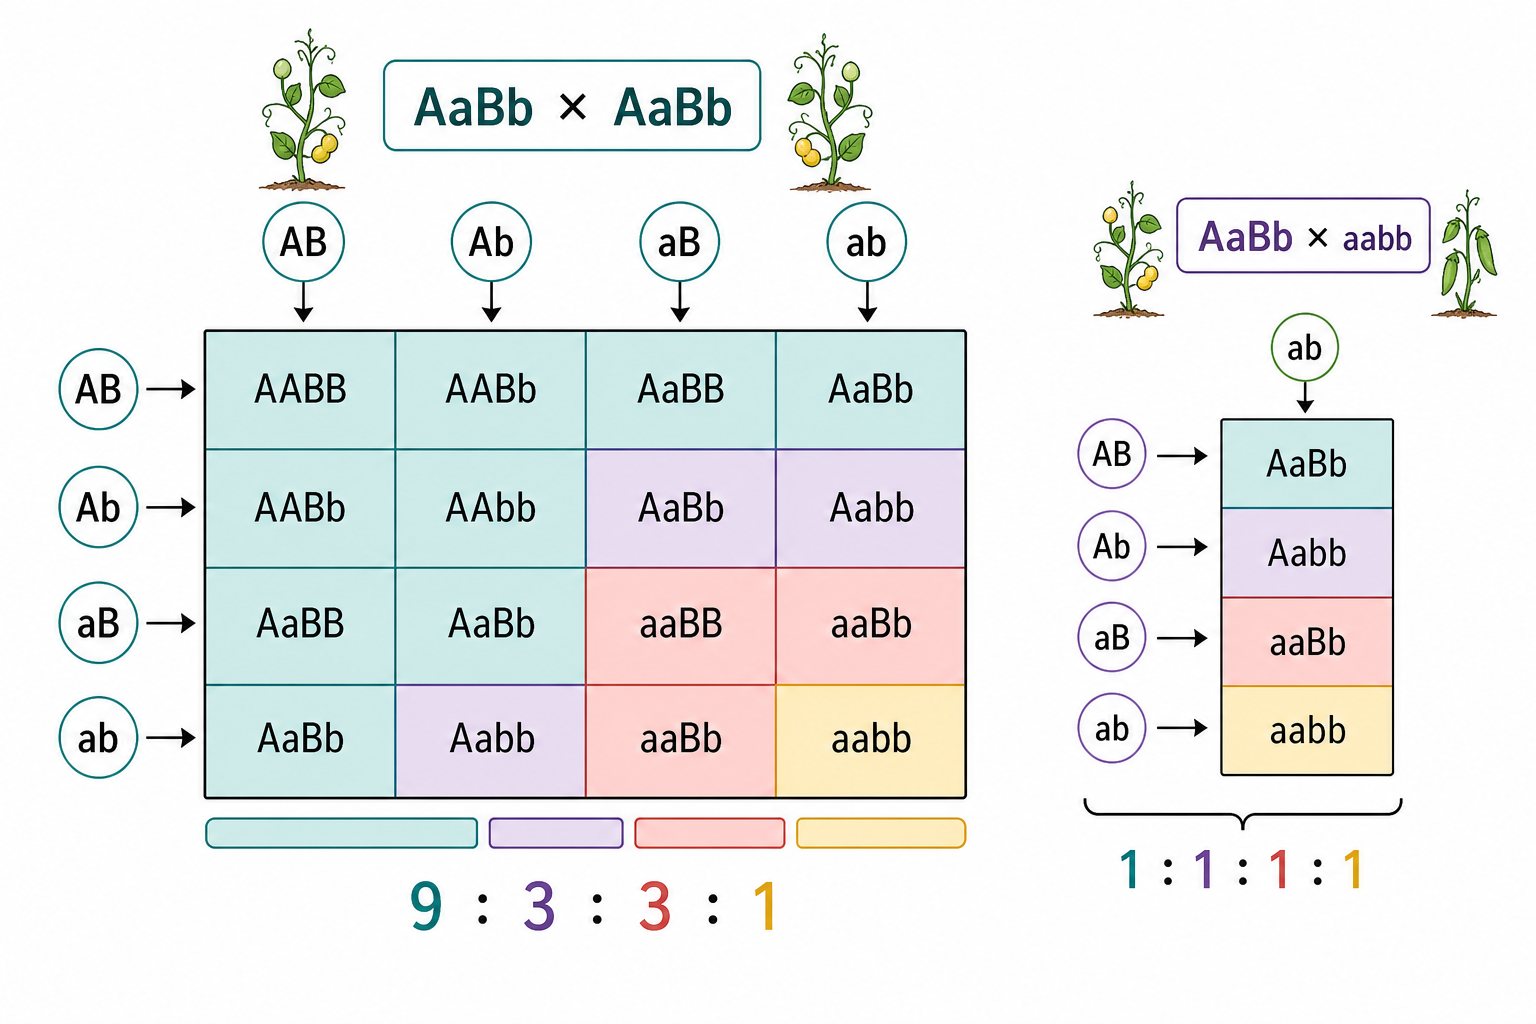
A dihybrid cross follows two genes at the same time. For unlinked autosomal genes, Aa Bb parents can make AB, Ab, aB, and ab gametes. Aa Bb x Aa Bb gives the classic 9:3:3:1 F2 phenotype ratio, while Aa Bb x aabb gives a 1:1:1:1 test-cross ratio.
Dihybrid ratios come from gamete combinations plus a Punnett grid.
Which ratio fits Aa Bb x Aa Bb for two unlinked genes with complete dominance?
ChooseWhich ratio fits Aa Bb x Aa Bb for two unlinked genes with complete dominance?
ChooseHuman gene loci
Genome databases identify a gene’s chromosome location, locus, and polypeptide product. This matters for inheritance because genes on different chromosomes are unlinked, while close loci on one chromosome can be linked. Genes far apart on one chromosome can behave as unlinked if recombination is frequent.
Match the database field to its use.
MatchAutosomal gene linkage
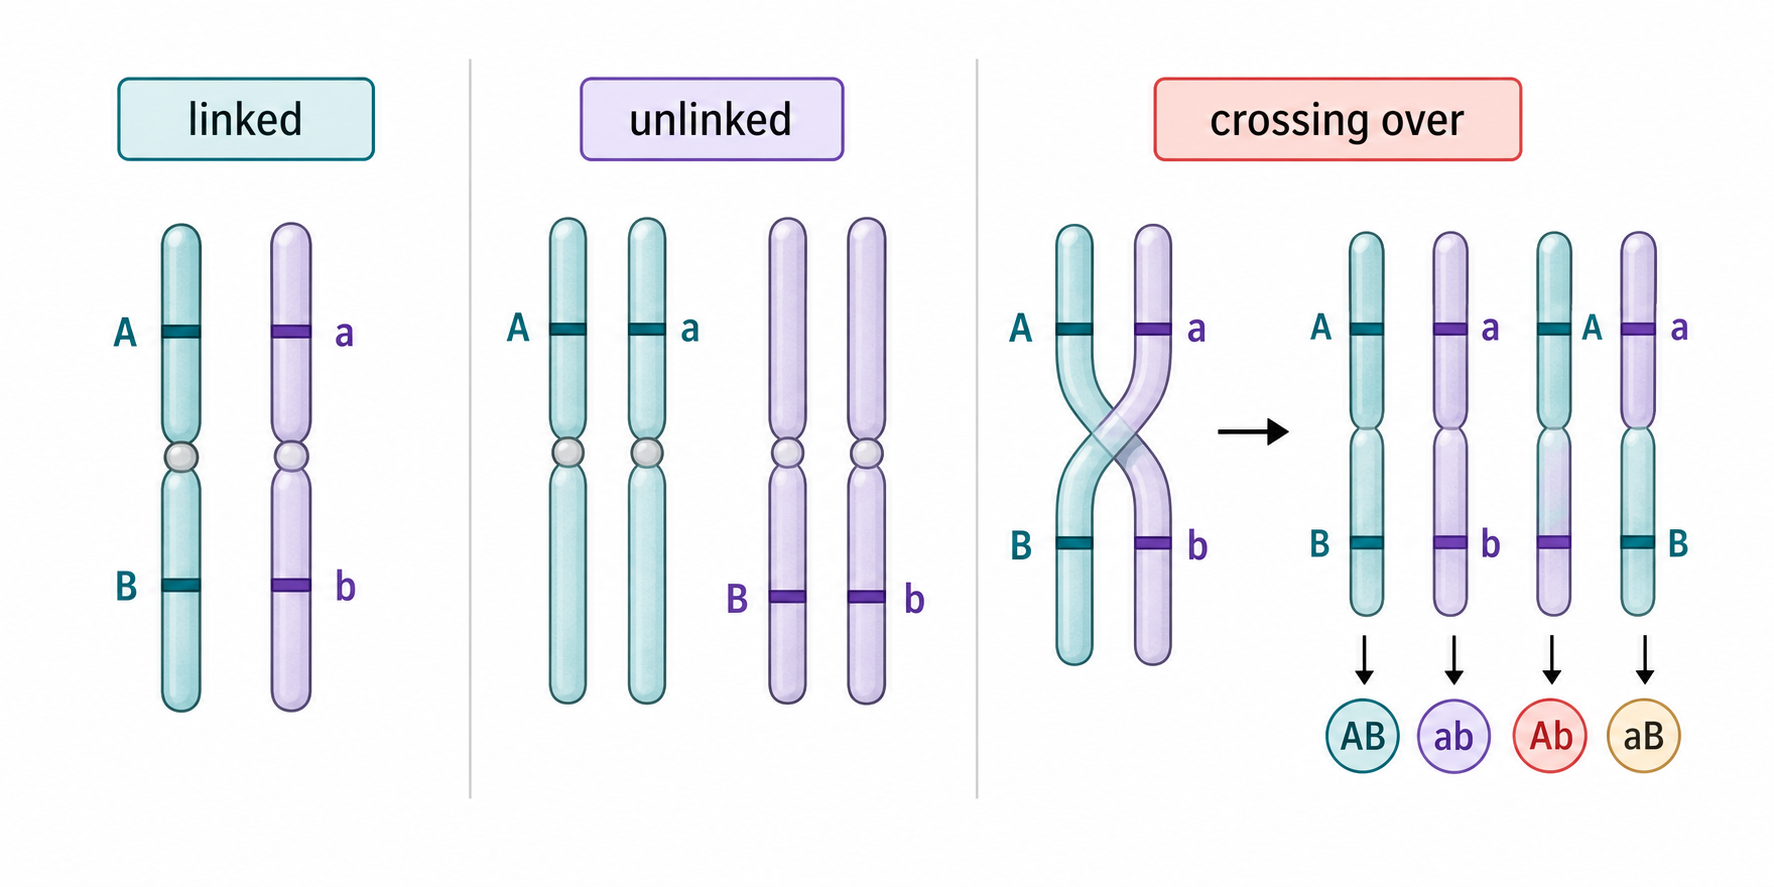
Autosomal linkage means two genes are on the same non-sex chromosome. Linked alleles tend to be inherited together because they travel on the same chromosome. Crossing over between the loci can separate them, but closer loci recombine less often, so parental combinations are more common.
Linked genes sit on the same autosome and tend to be inherited together.
Spot the error: linked genes assort independently because they are on the same chromosome.
Spot ErrorsSpot the error: linked genes assort independently because they are on the same chromosome.
ChooseRecombinants
A recombinant has an allele combination different from the parental chromosomes. In linked-gene test crosses, parental phenotypes are usually the most frequent classes. Recombinant phenotypes are less frequent because they require crossing over between the linked loci.
Sort the offspring class.
SortChi-squared test
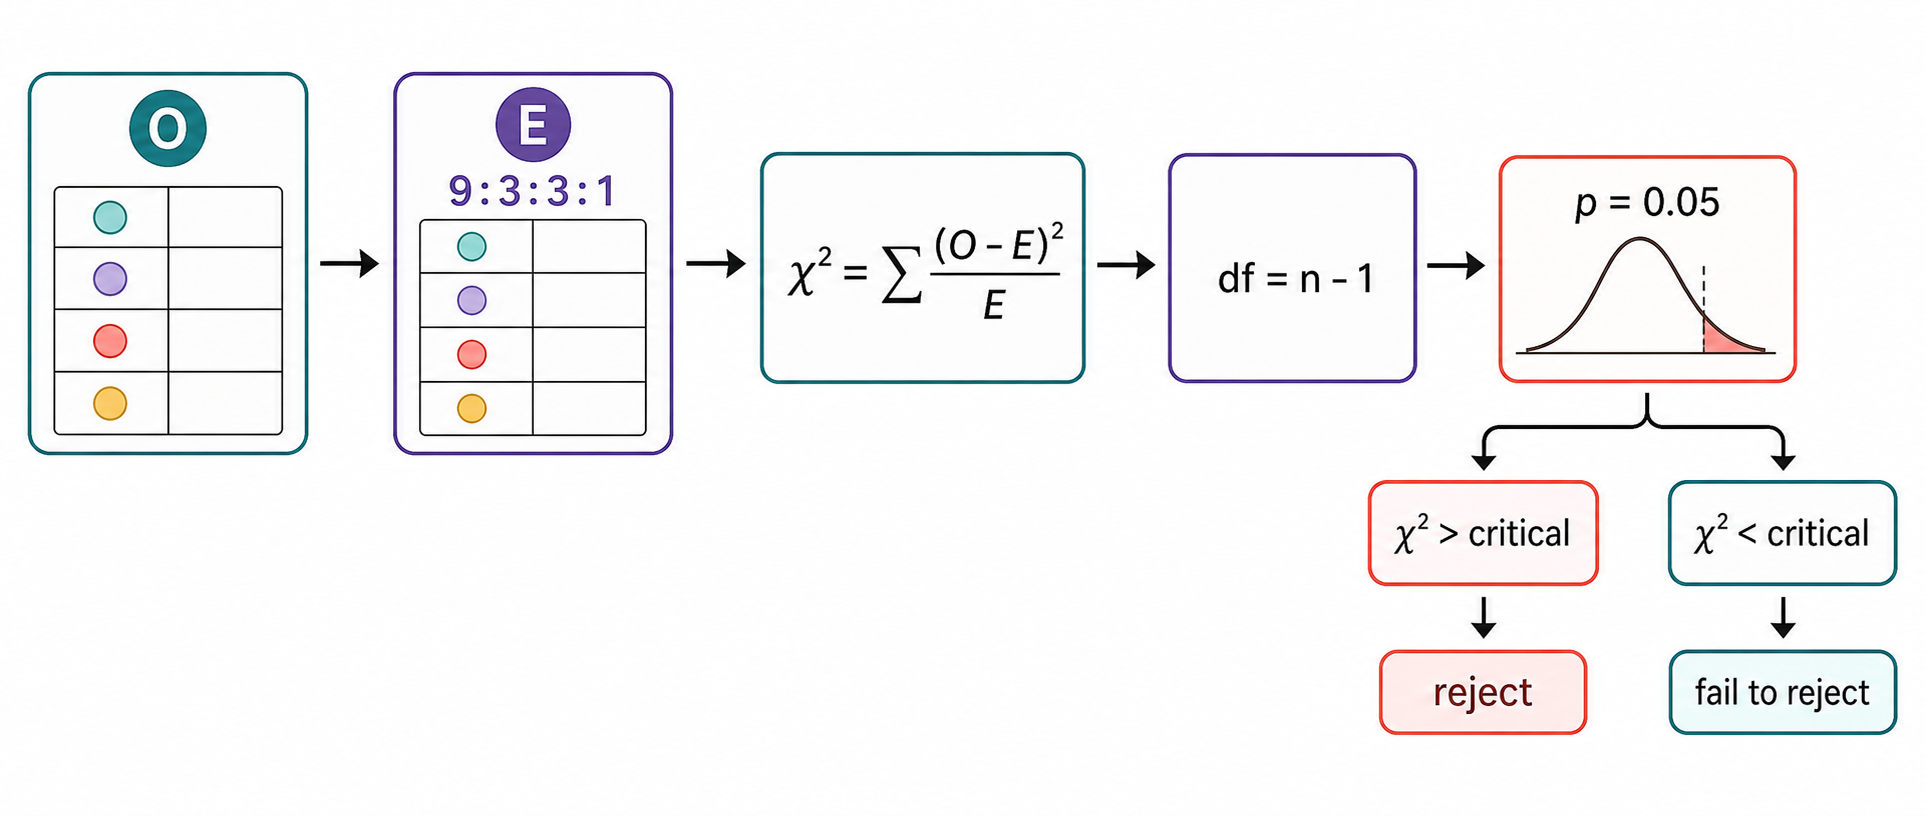
A chi-squared test asks whether observed genetic data fit an expected ratio closely enough. Calculate from observed and expected values, use degrees of freedom, and compare with the p = 0.05 critical value. If chi-squared is greater than the critical value, reject the null hypothesis.
Chi-squared tests whether observed offspring data fit an expected inheritance ratio.
Order the chi-squared decision workflow.
OrderOrder the chi-squared decision workflow.
ChooseRetrieve the Core Inheritance Route
ReviewCore D3.2 is secure when the student can move from allele rules into predictions and evidence: gametes form genotypes, genotypes can produce phenotypes, different dominance patterns need different notation, and pedigrees or plots require evidence-based interpretation.
Match each retrieval cue to its exam-use meaning.
MatchRetrieve the HL Inheritance Route
ReviewHL D3.2 is secure when chromosome behaviour explains the ratios: segregation and independent assortment produce unlinked dihybrid expectations, gene loci explain linkage, recombinants reveal crossing over, and chi-squared decides whether observed counts fit the expected model.
Match each retrieval cue to its exam-use meaning.
MatchTransfer: Solve Core Inheritance Questions
Exam PracticeCore inheritance exam questions reward disciplined reasoning. First identify the inheritance rule, then write the correct notation or evidence, then state the phenotype, ratio, or conclusion. This prevents the common mistake of writing definitions without solving the genetic problem.
Deduce or explain an inheritance outcome using genotype notation, phenotype evidence, or a family/data display.
Deduce or explain an inheritance outcome using genotype notation, phenotype evidence, or a family/data display.
ChooseMatch each exam move to the mark it earns.
MatchTransfer: Solve HL Linkage and Chi-Squared Questions
Exam PracticeHL inheritance transfer is about deciding whether the expected ratio should be Mendelian or linked, then testing the evidence. Start from meiosis and gene location, predict gametes or ratios, identify parental and recombinant classes, and use chi-squared when observed counts need a statistical conclusion.
Explain whether inheritance data fit independent assortment or linkage, and use chi-squared to support a conclusion where appropriate.
Explain whether inheritance data fit independent assortment or linkage, and use chi-squared to support a conclusion where appropriate.
ChooseMatch each exam move to the mark it earns.
Match