
Define a Population
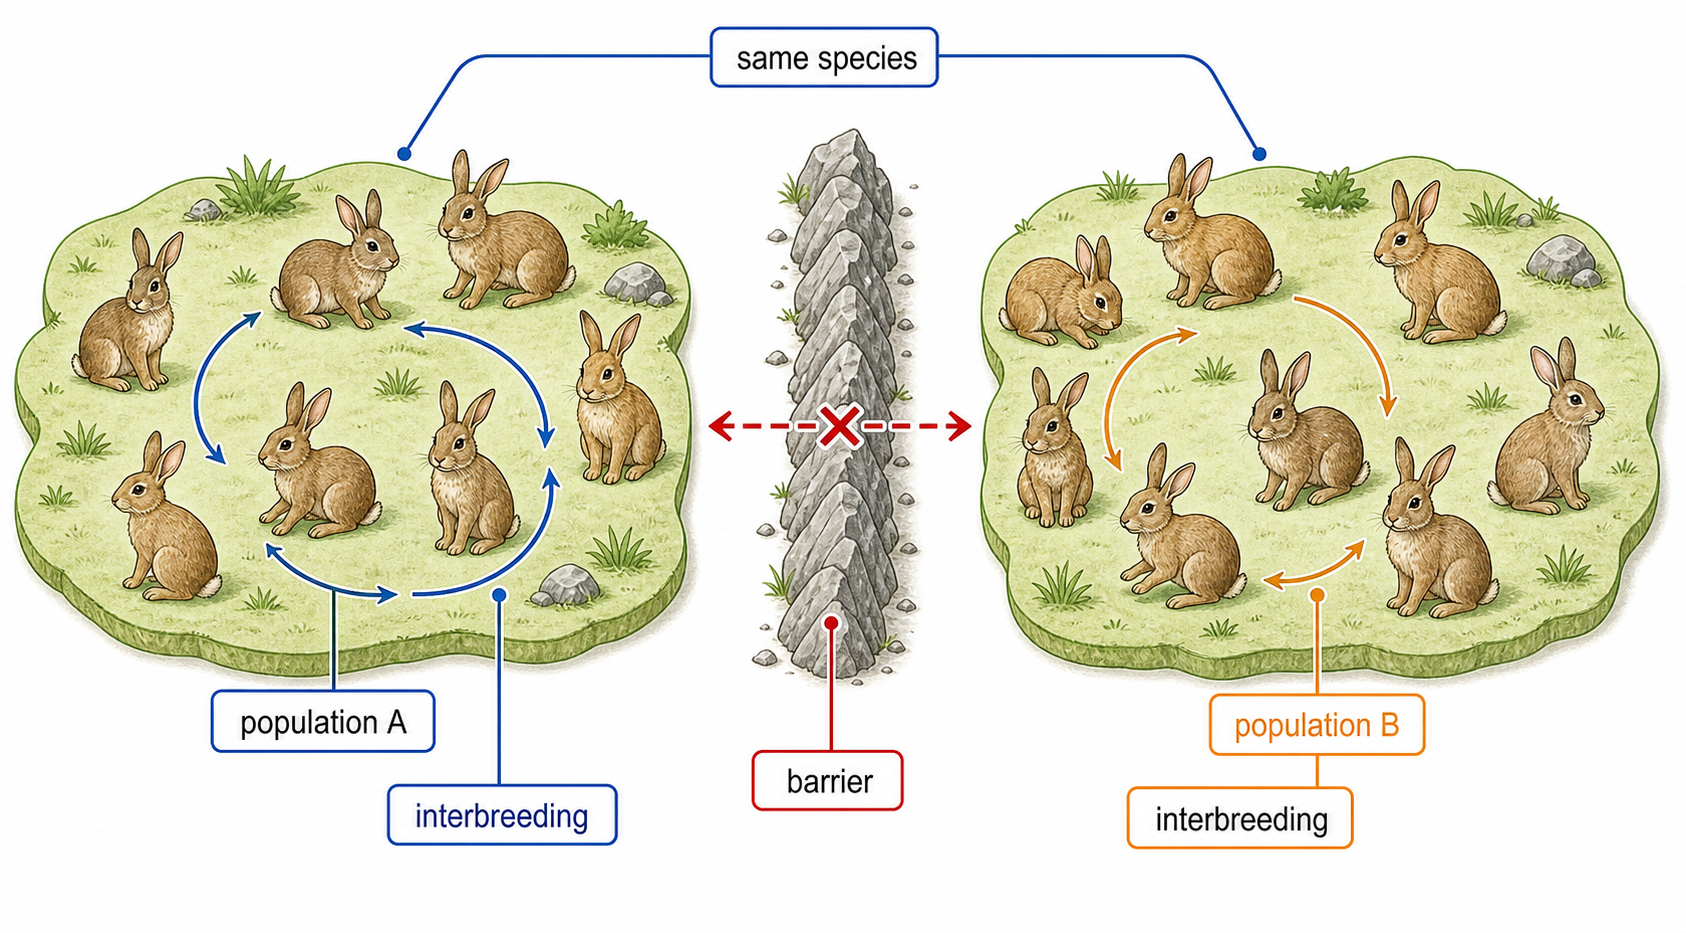
A population is not just a count of organisms. In IB wording, it is interacting organisms of the same species living in one area, where members have opportunities to interbreed and separate populations may be reproductively isolated from one another.
Population means same species plus shared area and interaction.
Match each ecological level to the correct wording.
MatchMatch each ecological level to the correct wording.
ChooseChoose a Sampling Method
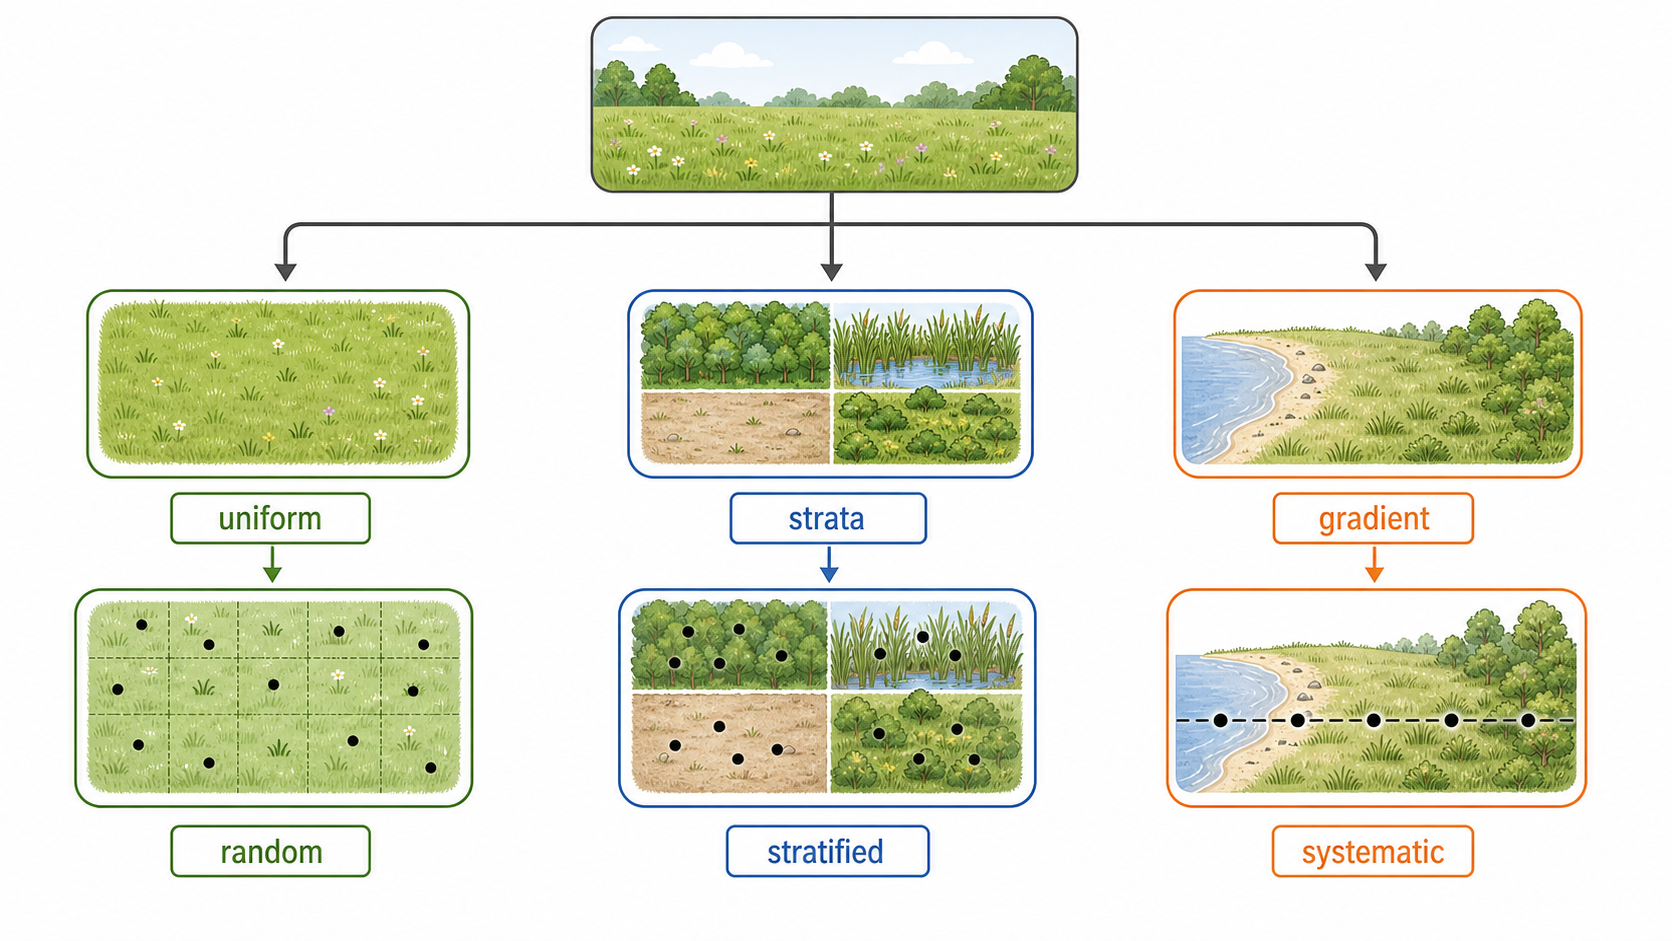
When a full count is impractical, the exam wants you to justify an estimate. Random sampling reduces bias in a fairly uniform habitat, stratified sampling covers known habitat zones, and systematic sampling samples along a gradient or transect.
Good population estimates match the sampling design to the habitat.
Sort each situation by the best sampling design.
SortSort each situation by the best sampling design.
ChoosePlace Random Quadrats
Practice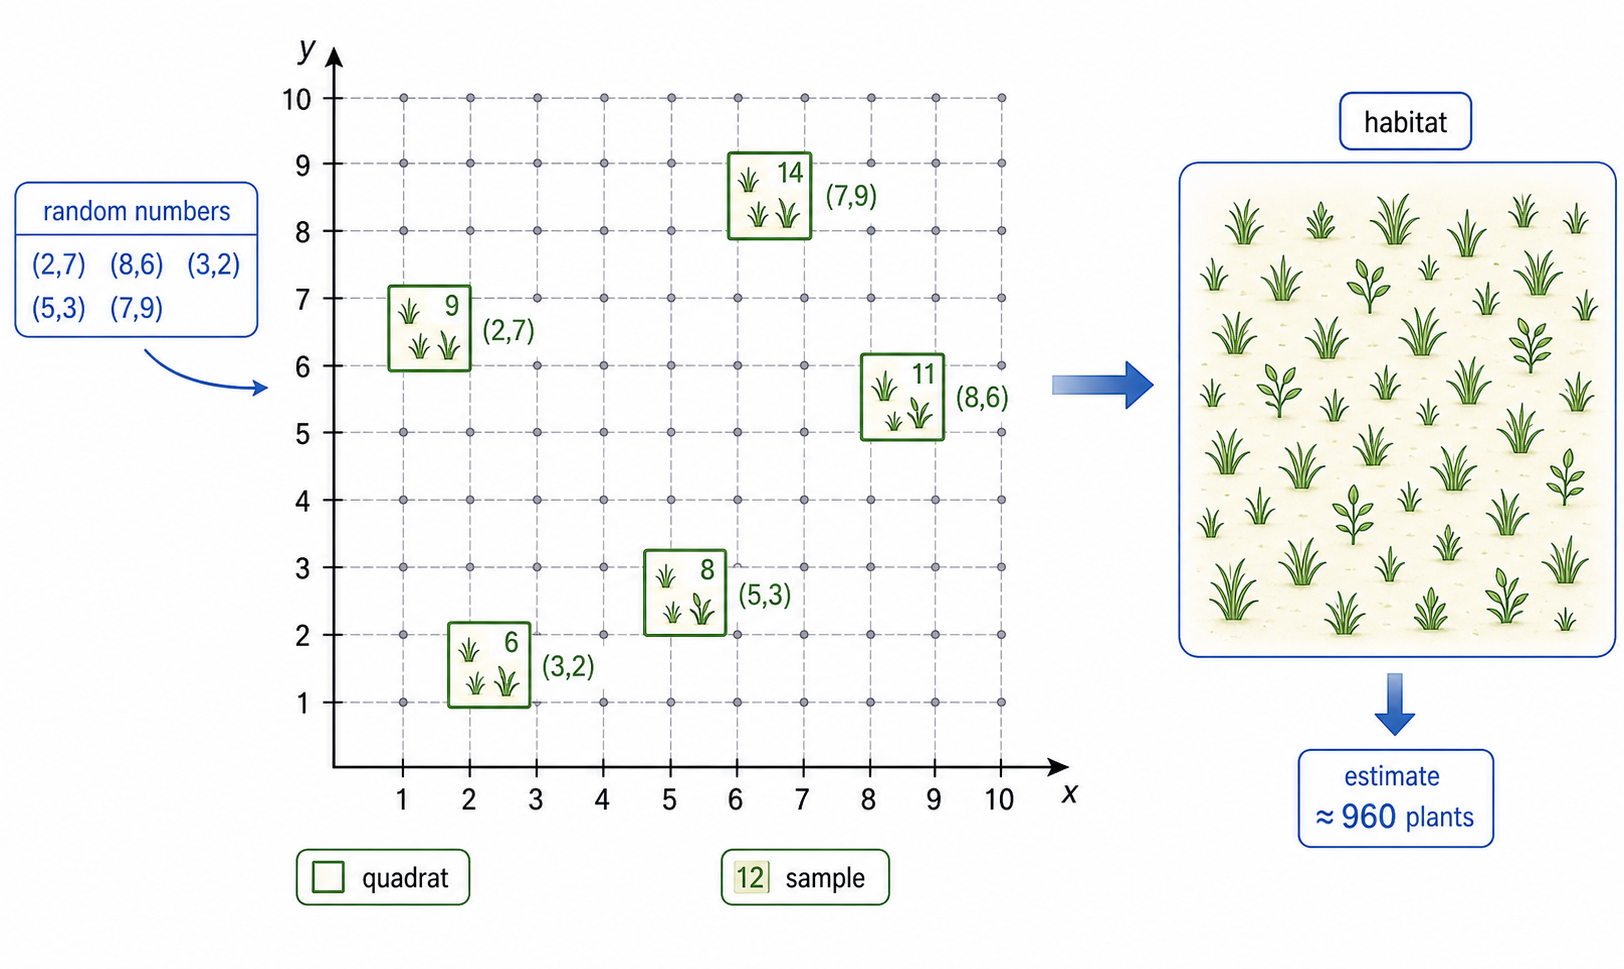
Quadrats work best for sessile organisms because you can sample a known area without the organism moving away. Random coordinates prevent the student from choosing convenient patches, and quadrat area lets density, frequency, cover, or abundance be scaled to the whole habitat.
Random placement plus known area makes a quadrat estimate defensible.
Sort the fieldwork choices.
SortSort the fieldwork choices.
ChooseUse Capture-Mark-Recapture
Practice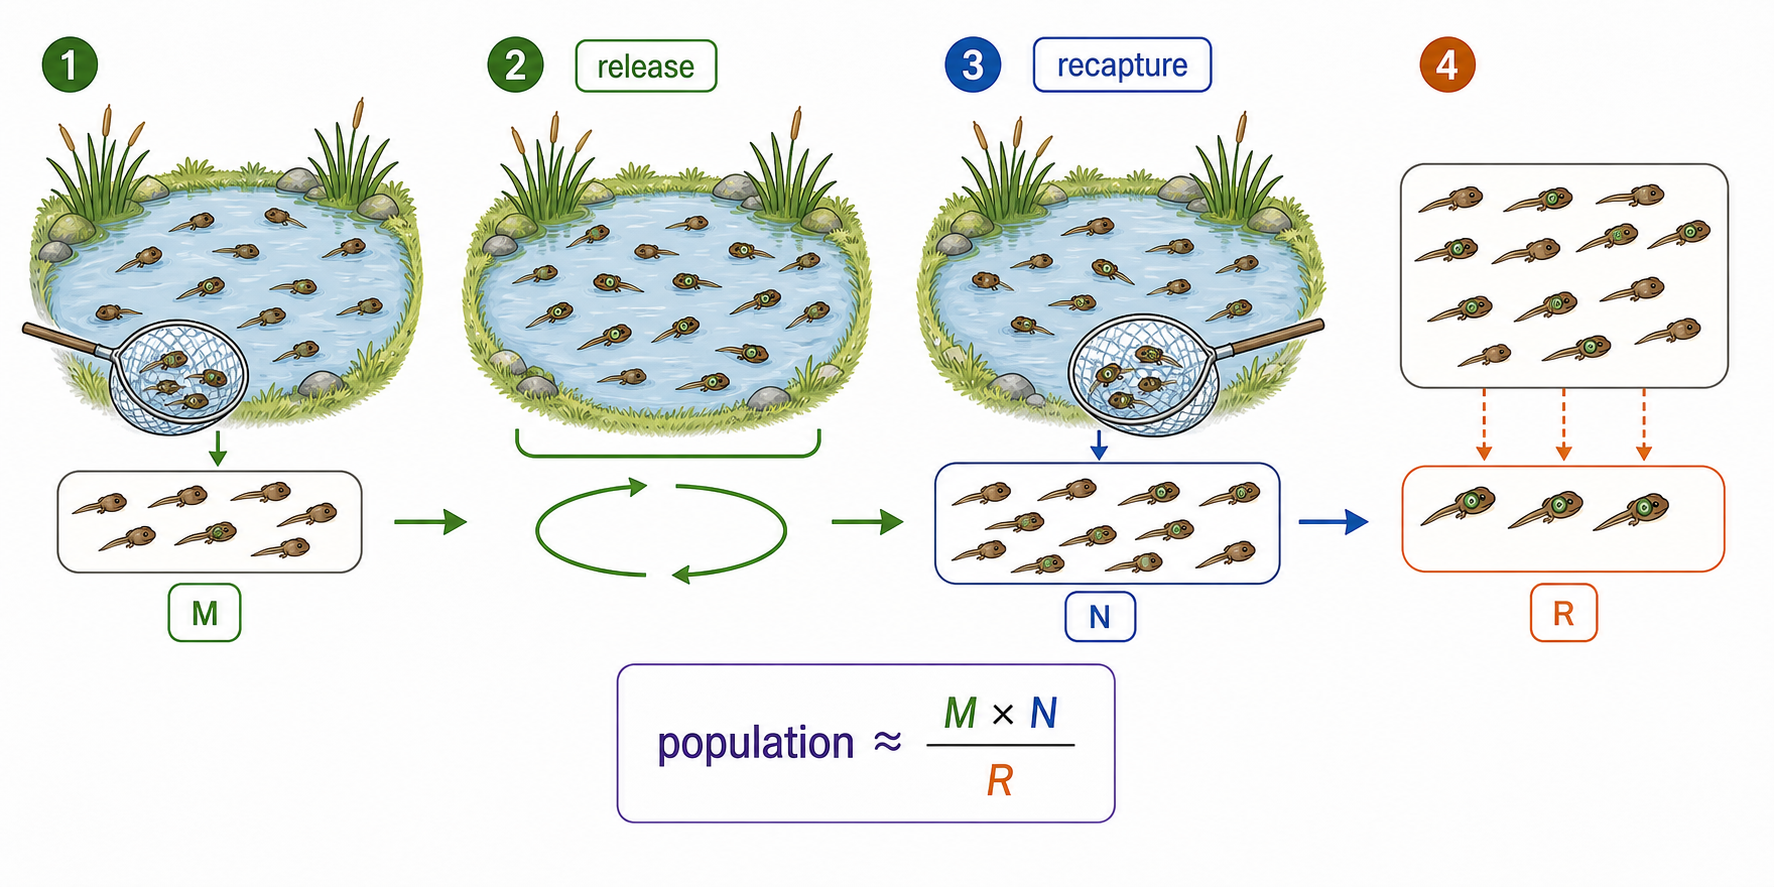
Capture-mark-release-recapture estimates motile animals by asking what fraction of the second sample was already marked. The Lincoln index is population estimate = M x N / R, but exam marks often also require assumptions: marks persist, animals mix, capture chance is similar, and marking does not affect survival.
The calculation compares marked animals in the second sample with the first marked group.
40 animals are marked first. Later 50 are recaptured, and 10 are marked. What is the best exam response?
Choose40 animals are marked first. Later 50 are recaptured, and 10 are marked. What is the best exam response?
ChooseExplain Carrying Capacity
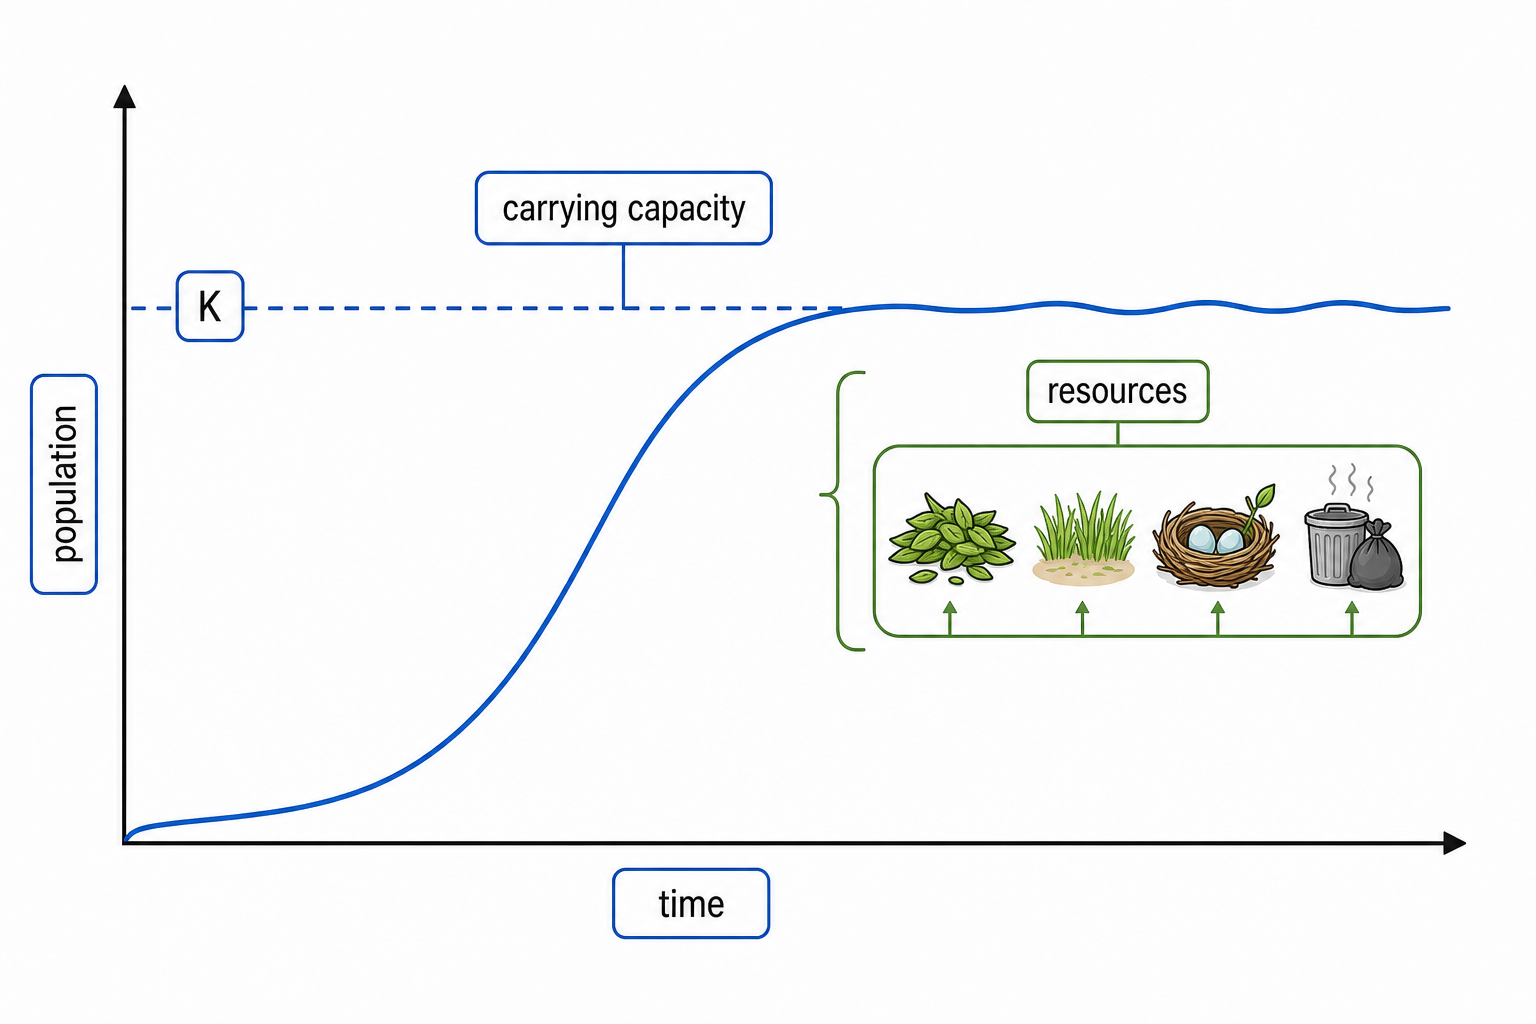
Carrying capacity is the maximum population an environment can sustain over time. The cause is limited resources: as food, space, mates, or light become scarce, competition increases, natality can fall, mortality can rise, and growth slows near the limit.
The plateau is explained by limiting resources and competition.
A population is near carrying capacity and food supply decreases. Predict the growth-rate change.
PredictA population is near carrying capacity and food supply decreases. Predict the growth-rate change.
ChooseTrace Negative Feedback
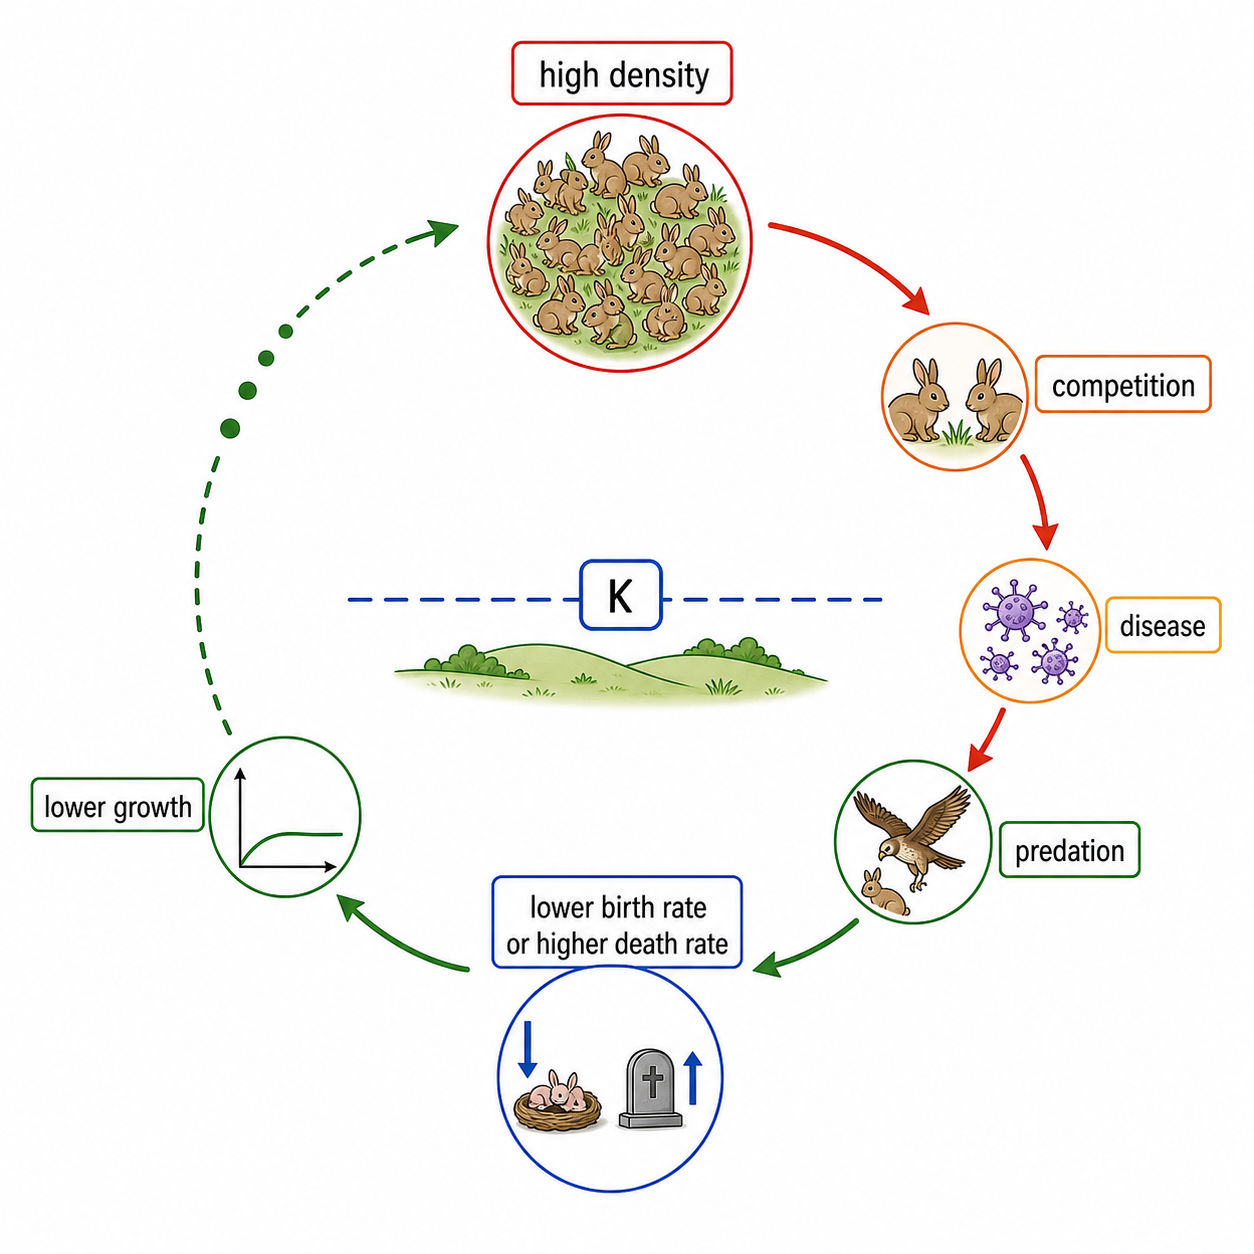
Negative feedback in populations means the control gets stronger as density rises. More crowded populations face stronger competition, predation, waste buildup, and disease, so mortality rises or natality falls and the population is pushed back toward carrying capacity.
Density-dependent regulation is a feedback loop.
Sort each factor.
SortSort each factor.
ChooseCompare Growth Curves
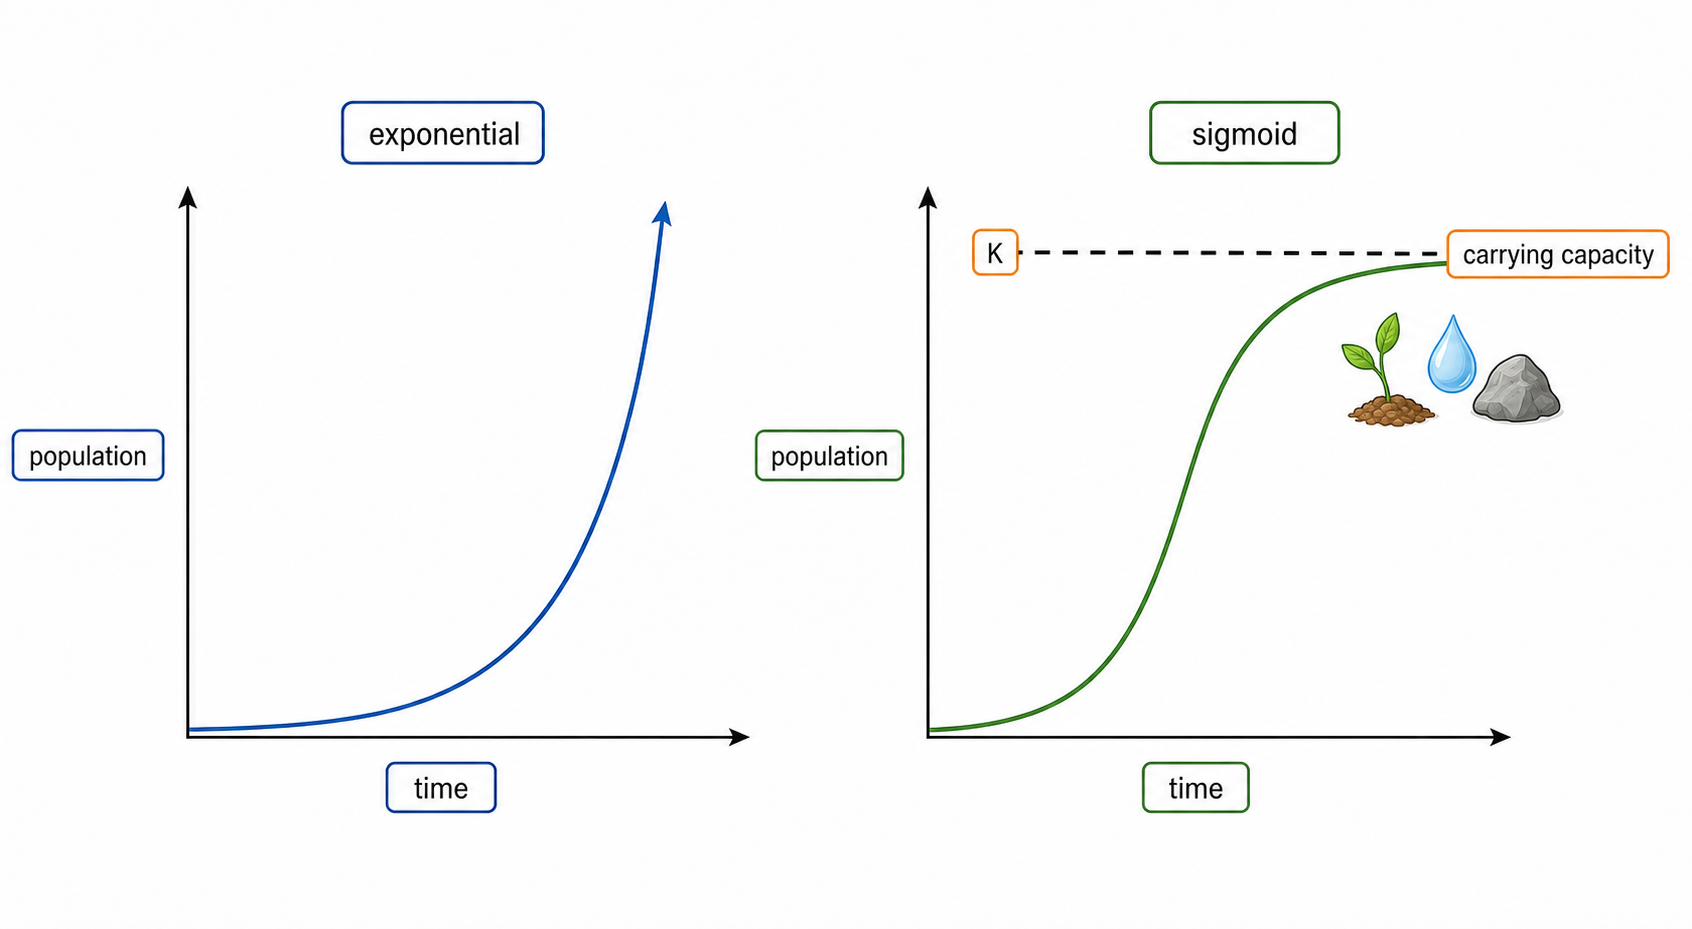
Exponential growth happens when resources are abundant and limiting factors are weak, so the population keeps accelerating. Sigmoid growth may begin with a fast increase, but it slows and levels off as resources become limiting near carrying capacity.
Curve shape shows how limiting factors change.
Compare the two curves and pick the resource explanation.
CompareCompare the two curves and pick the resource explanation.
ChooseRead a Sigmoid Model
Practice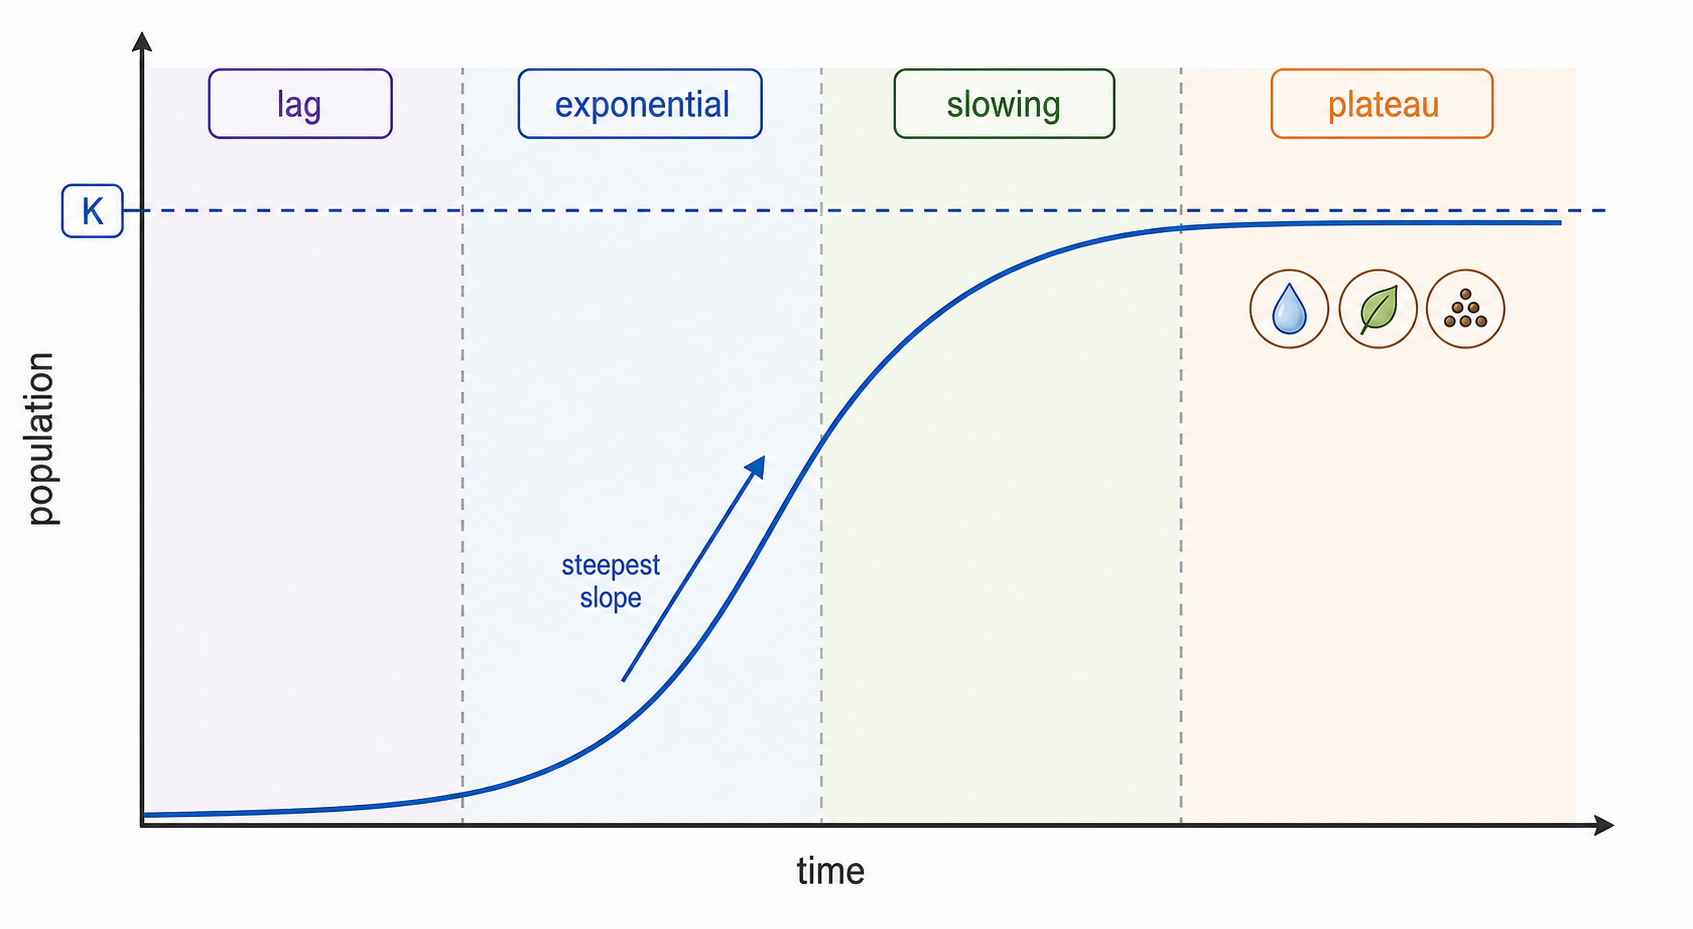
Fast-growing organisms such as yeast or duckweed make sigmoid growth visible in classroom data. Read the curve by slope: lag is slow adaptation, exponential is fastest increase, transition slows as limiting factors appear, and plateau shows little net growth near carrying capacity.
The slope, not just the height, shows growth rate.
Use the sigmoid graph phases to answer.
GraphUse the sigmoid graph phases to answer.
ChooseSeparate Competition and Cooperation
PracticeWithin a population, individuals can compete or cooperate. Intraspecific competition occurs for limited food, mates, space, or light, while cooperation such as social hunting or parental care can increase survival and reproductive success.
Sort the same-species interactions.
SortDefine a Community
A community is all the interacting populations in an ecosystem. The key step up from population is that different species are now included, and their interactions make population changes interdependent within the abiotic environment.
A community is built from interacting populations.
Match the ecological level to the example.
MatchMatch the ecological level to the example.
ChooseClassify Species Relationships
Practice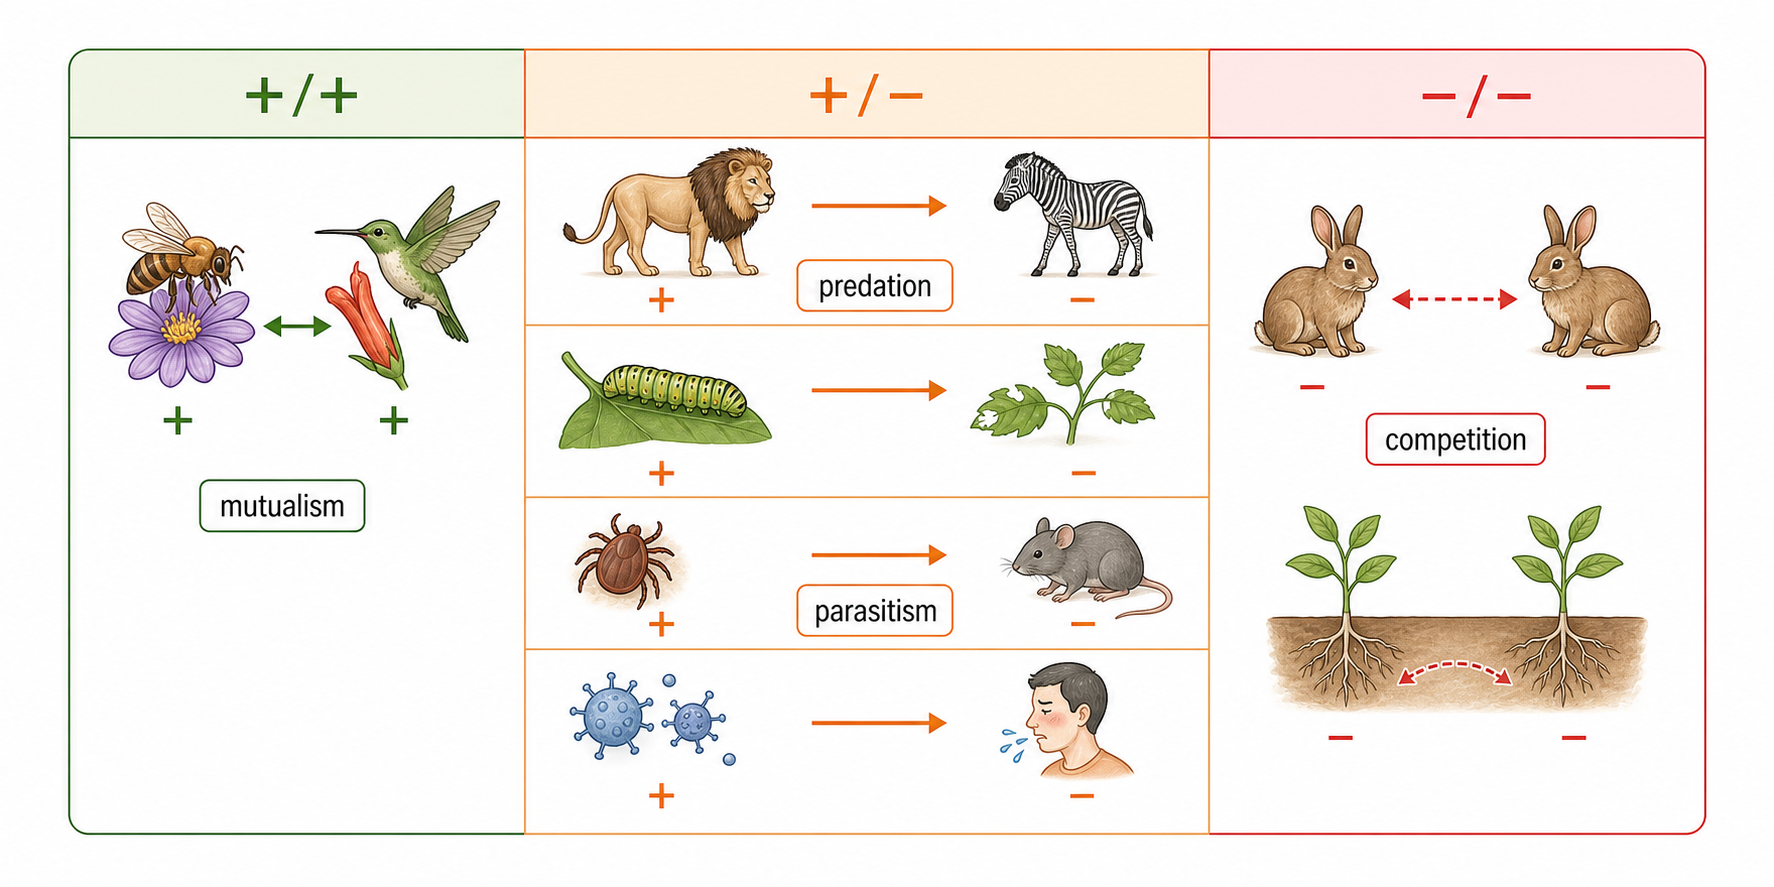
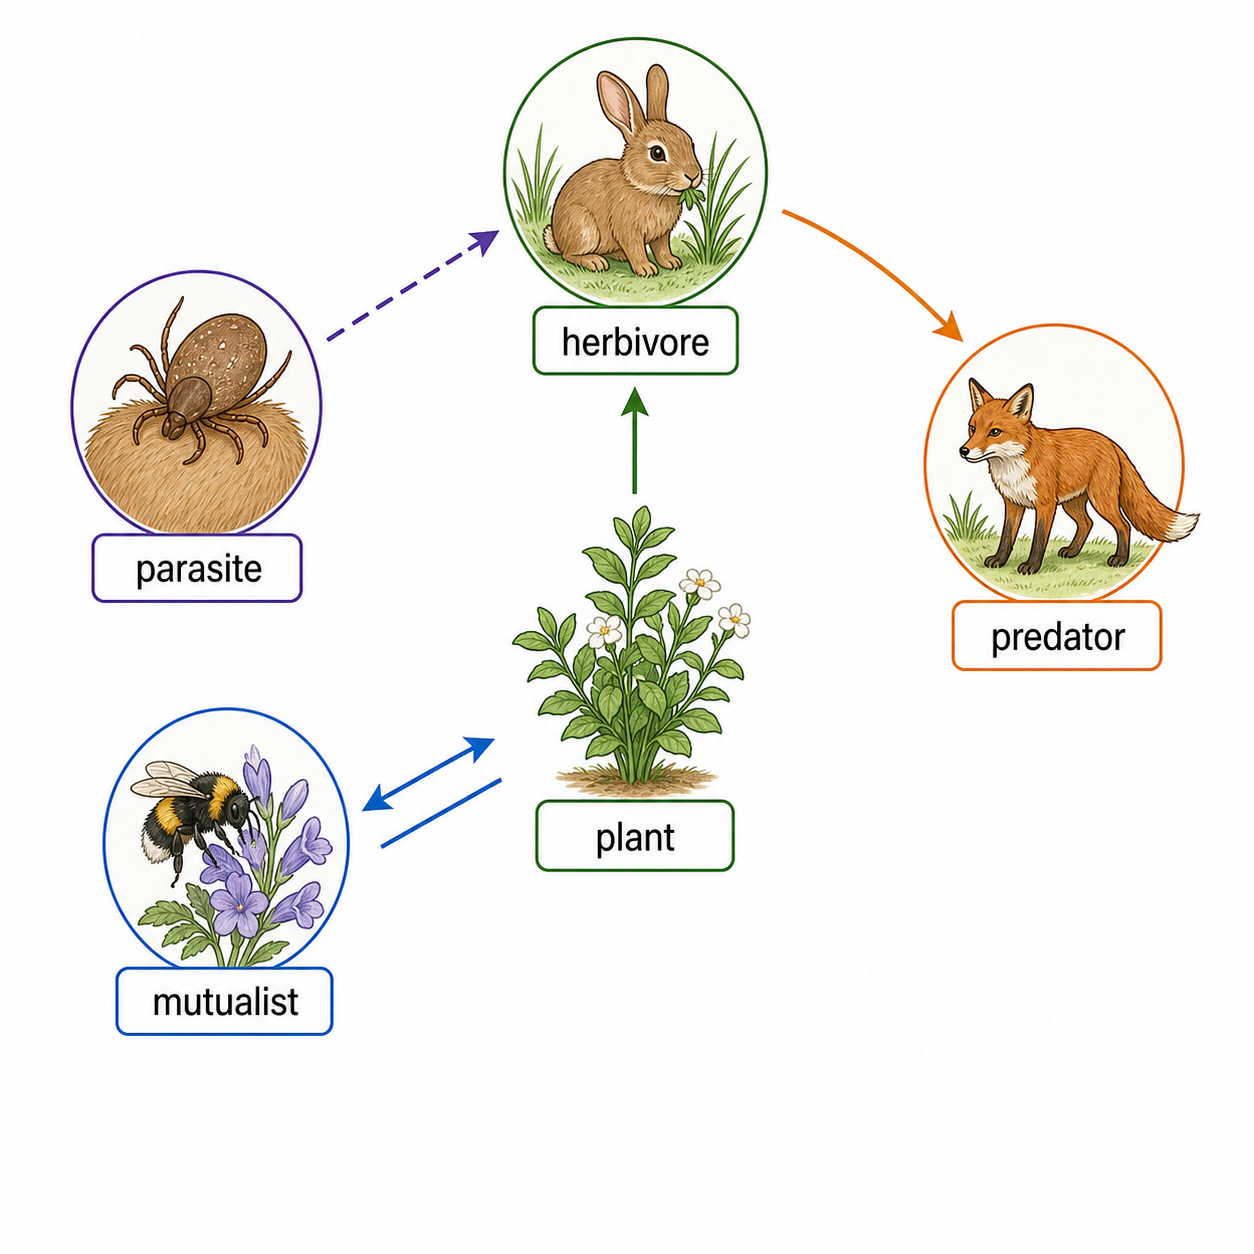
Interspecific relationships are interactions between different species in a community. Classify them by the effect on each species: predation and herbivory involve consumption, competition harms both through shared resource limits, mutualism benefits both, and parasitism or pathogenicity benefits one while harming the host.
Benefit/harm logic sorts relationship names.
Match each relationship to its effect pattern.
MatchMatch each relationship to its effect pattern.
ChooseRecognize Mutualism
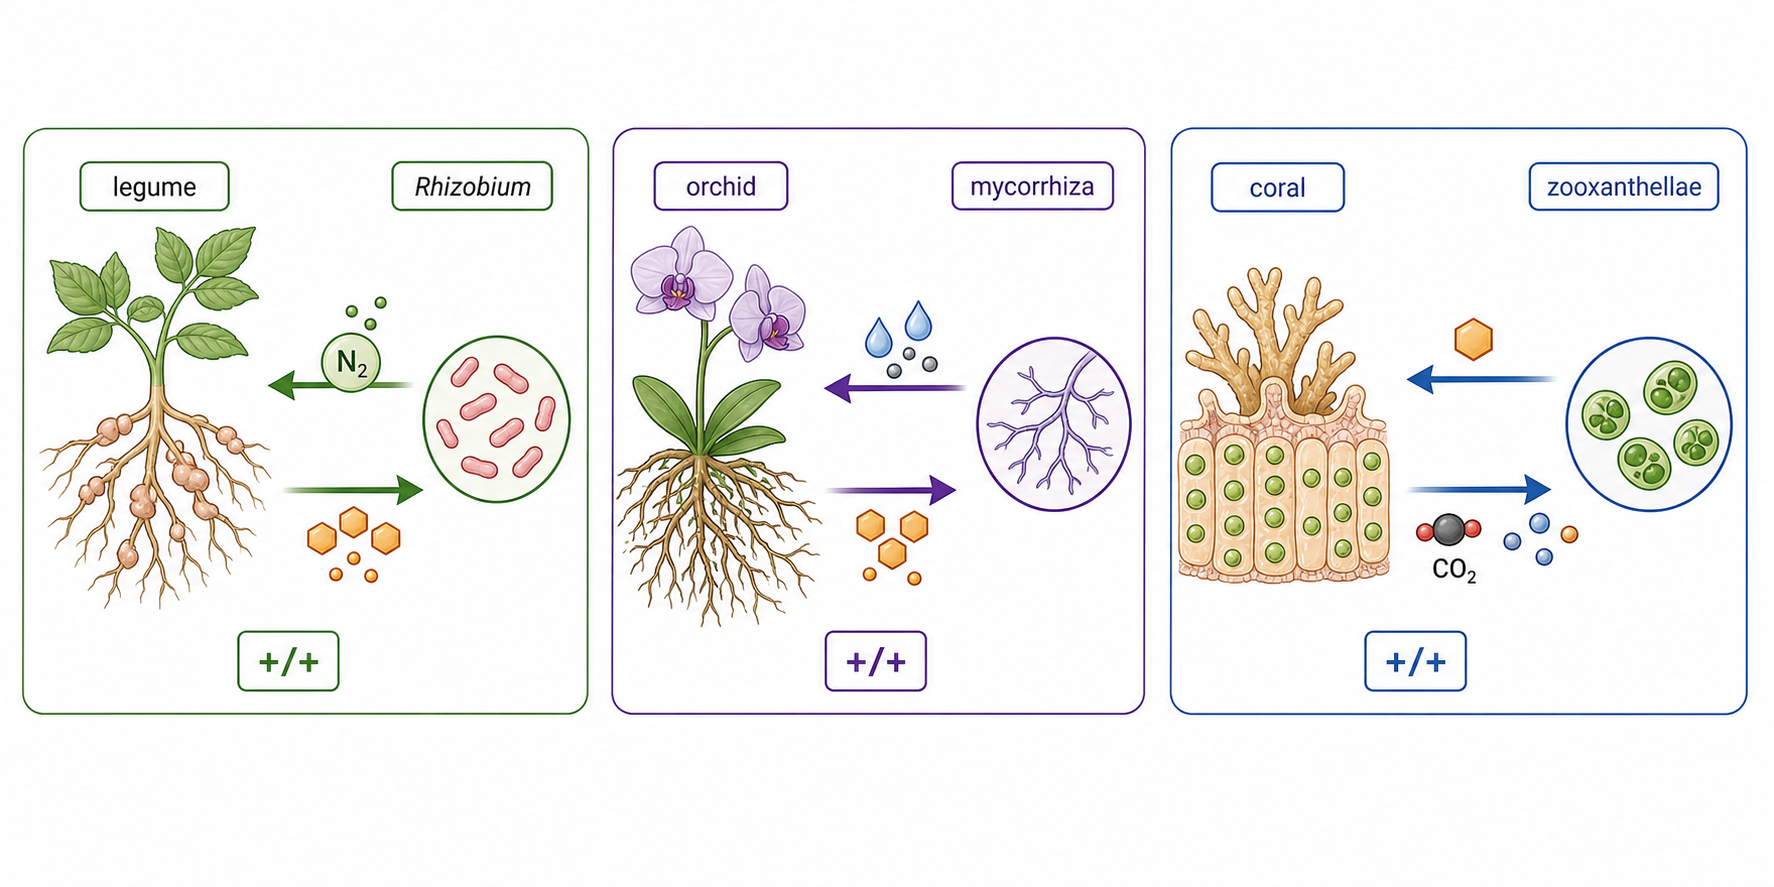
Mutualism means both species benefit, usually through exchanged resources or protection. IB examples worth recognizing are legumes and Rhizobium, orchids and mycorrhizae, and corals with zooxanthellae; in each case, state what each partner gains.
For mutualism, say what both partners gain.
Match each mutualism pair to the benefit logic.
MatchMatch each mutualism pair to the benefit logic.
ChooseCompare Endemic and Invasive Species
Practice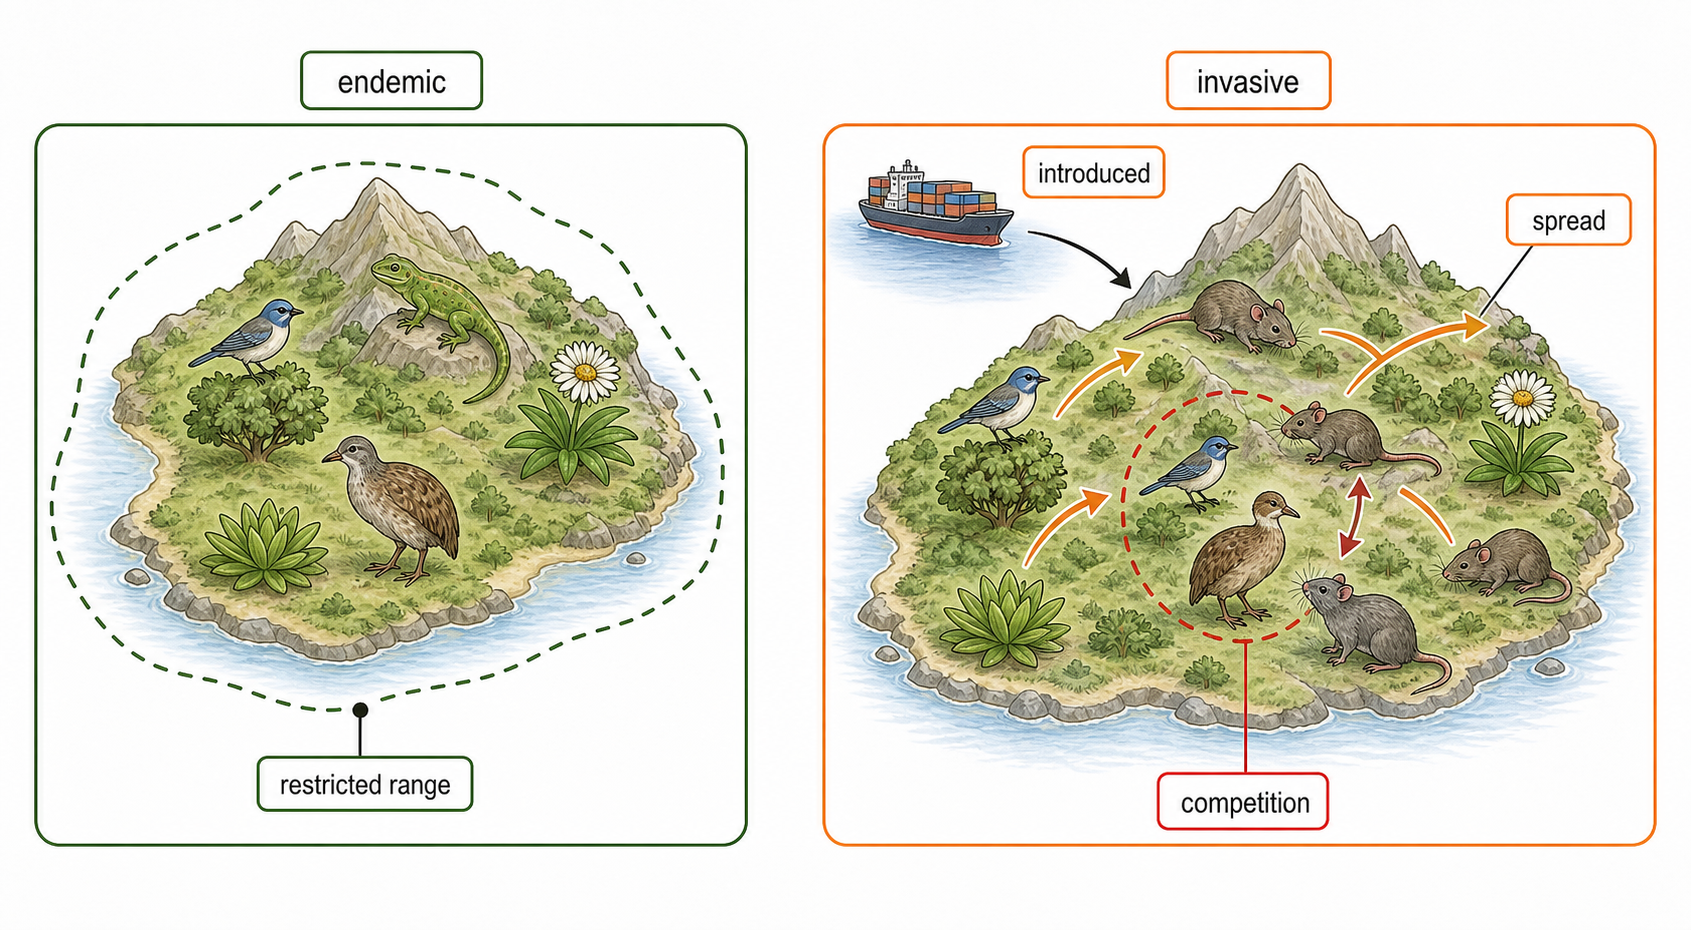
An endemic species is native to a restricted geographic area. An invasive species is introduced or spreading in a way that can escape normal controls and compete with endemic species for niche resources, so the exam often asks for both the definition and the ecological consequence.
Endemic is range; invasive is spread plus impact.
Compare the two species profiles.
CompareCompare the two species profiles.
ChooseTest for Competition

Competition is not proven just because two species occur in a pattern. Stronger evidence comes from lab experiments, field observations, or removal studies; Connell's barnacle study is the classic example because removing one species showed that the other could occupy a wider fundamental niche than its usual realized niche.
Removal studies test whether competition limits realized niche.
A barnacle expands lower down the shore only after a competitor is removed. What does this show?
PredictA barnacle expands lower down the shore only after a competitor is removed. What does this show?
ChooseUse the Chi-Squared Test
Practice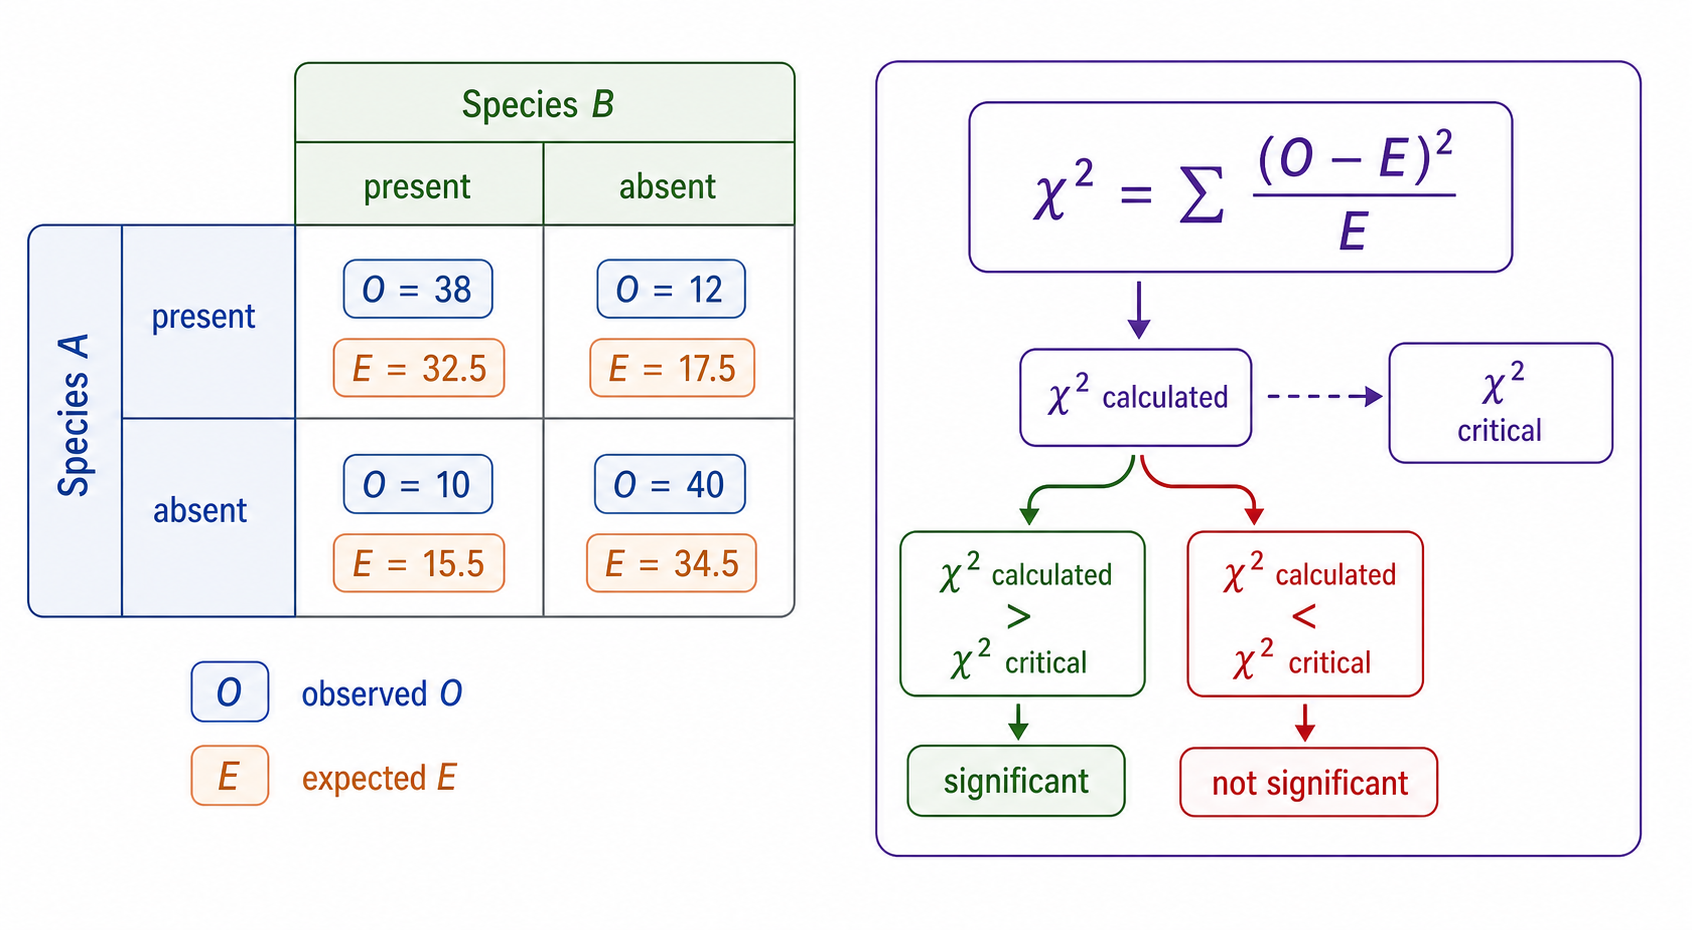
A chi-squared test checks whether the presence or absence of two species is associated in quadrat data. The exam route is: make a 2 x 2 table, calculate expected counts from row total x column total / grand total, calculate chi-squared, use degrees of freedom, compare with the critical value, then interpret association cautiously.
Statistics tests association; biology explains mechanism.
Read the chi-squared workflow.
GraphRead the chi-squared workflow.
ChooseTrack Predator-Prey Cycles
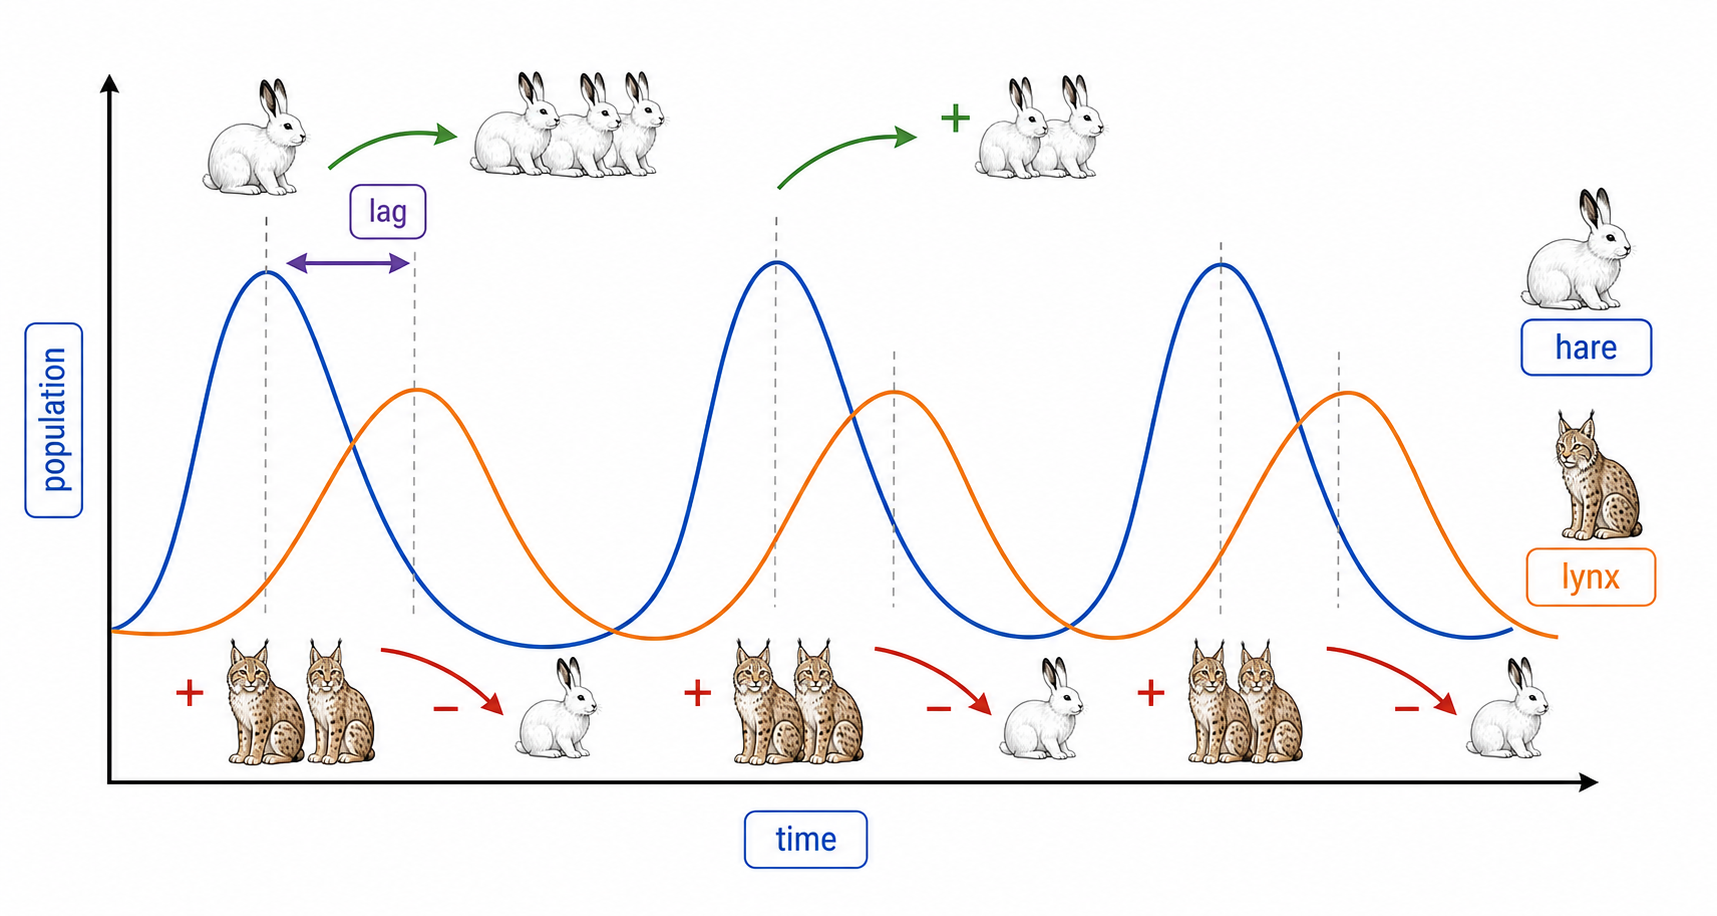
Predator-prey relationships regulate populations through density-dependent feedback. In the snowshoe hare and lynx cycle, hare numbers rise first, lynx numbers rise after a time lag, higher predation pushes hare numbers down, and the lynx population later falls because food is reduced.
Prey change first; predator response lags.
Interpret the predator-prey cycle.
GraphInterpret the predator-prey cycle.
ChooseCompare Top-Down and Bottom-Up Control
Practice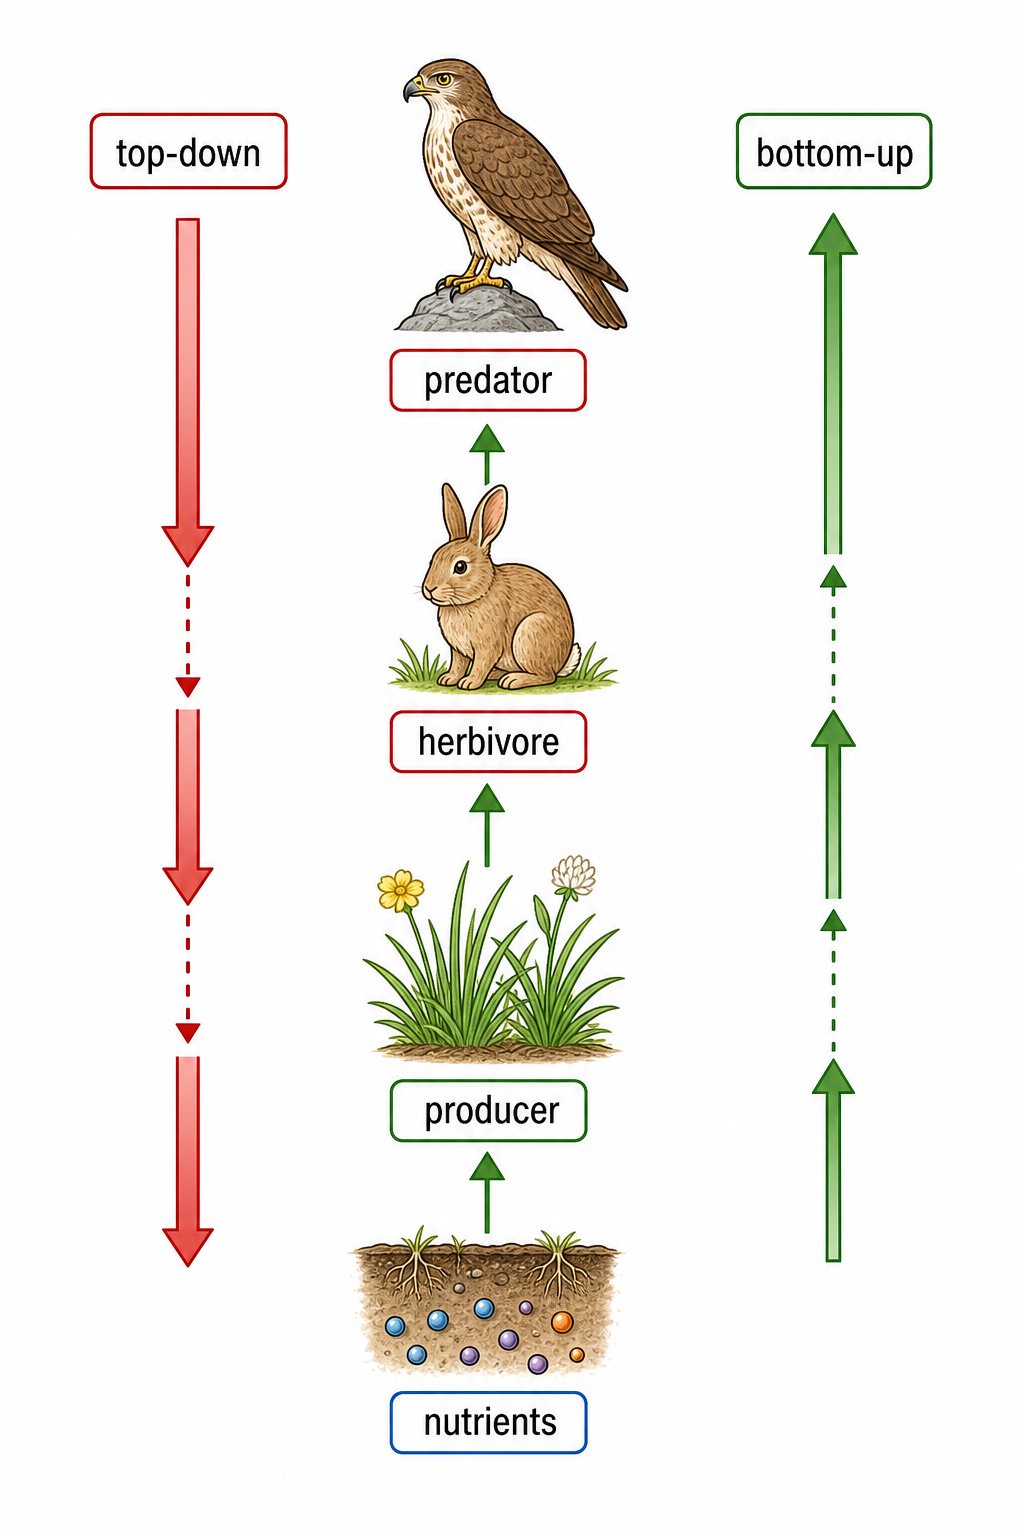
Top-down control starts with predators or consumers and cascades to lower trophic levels. Bottom-up control starts with producers, nutrients, or resource supply and then affects organisms higher in the food web; the key is the starting point of the causal change.
Control type depends on where the causal change starts.
Sort each scenario by control direction.
SortSort each scenario by control direction.
ChooseLink Allelopathy and Antibiotics
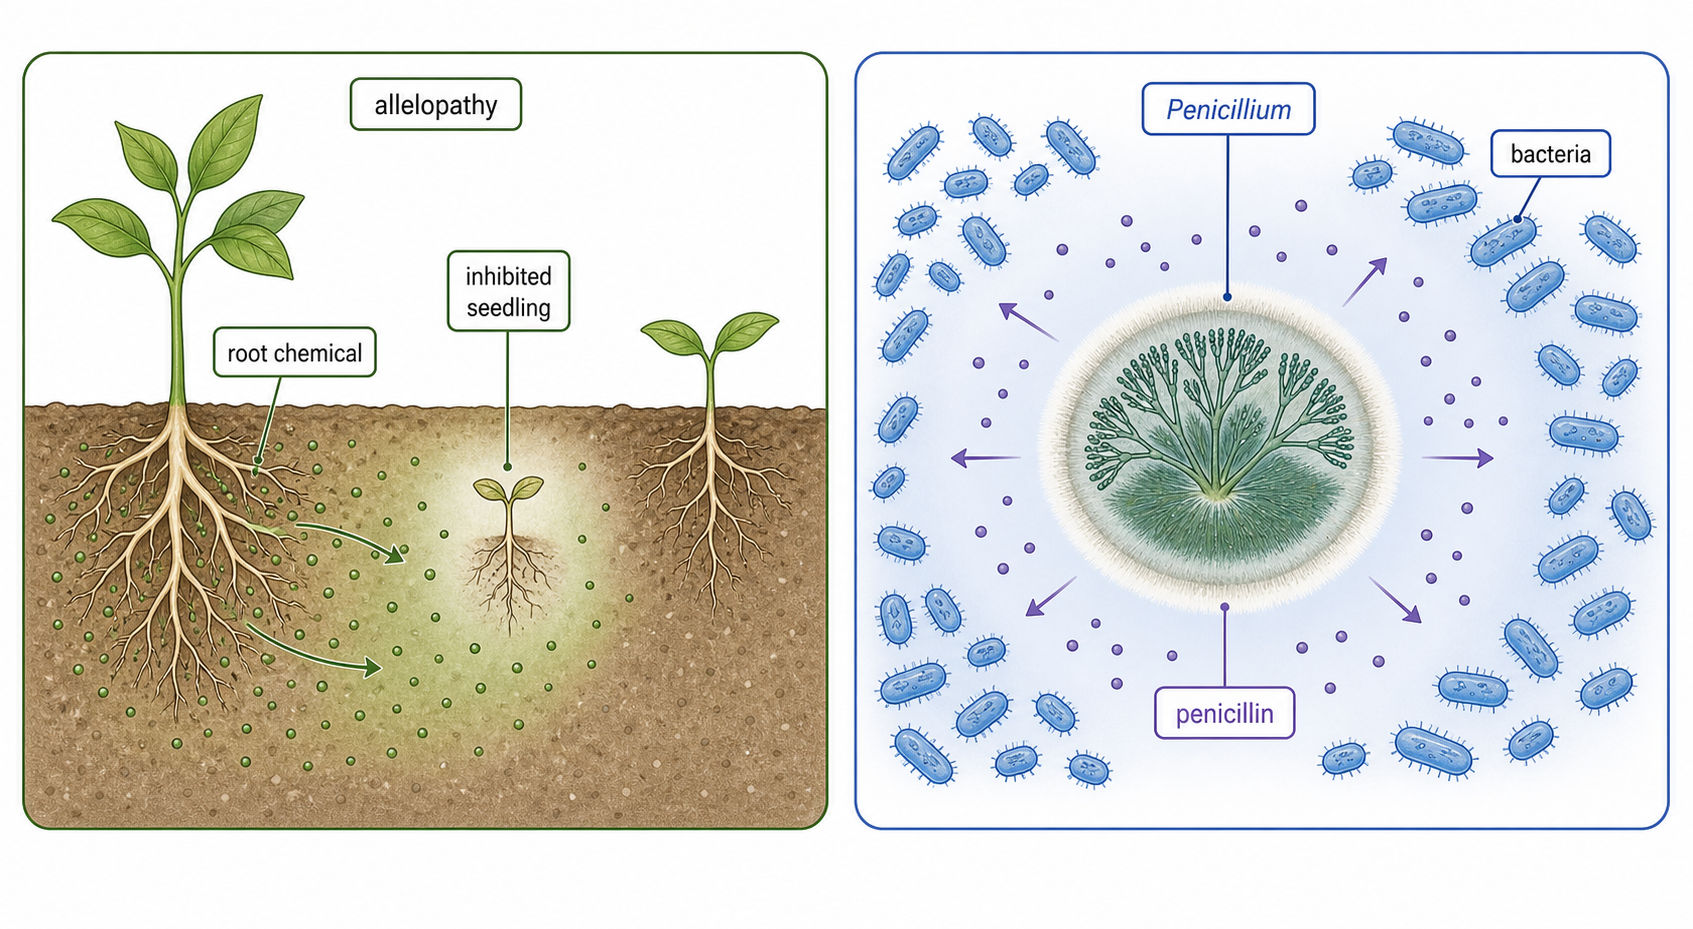
Allelopathy is chemical competition: one organism releases chemicals that inhibit the germination or growth of competitors. Antibiotics are microbial allelochemicals, so penicillin from Penicillium is a clear example of a chemical released by one organism that inhibits another.
Allelopathy and antibiotics both show chemical competition.
Match the chemical interaction to its consequence.
MatchMatch the chemical interaction to its consequence.
ChooseTransfer: Explain Populations and Communities
Exam PracticeC4.1 can be organized as a connected answer chain. Population: interacting organisms of the same species in one area, with possible interbreeding and possible reproductive isolation from other populations. Sampling: use estimates when full counts are impractical; choose random, stratified, or systematic sampling to reduce bias for the habitat pattern. Quadrats: estimate density, frequency, cover, or abundance of sessile organisms using random coordinates and known quadrat area. Capture-mark-release-recapture: estimate motile animal populations with Lincoln index M x N / R and check marks, mixing, capture chance, and survival assumptions. Carrying capacity: maximum population an environment can sustain because food, space, mates, light, or other resources become limiting. Negative feedback: density-dependent factors such as competition, predation, waste, and disease strengthen as density rises and push populations back toward carrying capacity. Growth curves: exponential growth occurs with abundant resources and weak limiting factors; sigmoid growth slows near carrying capacity. Sigmoid modelling: yeast or duckweed can show lag, exponential, transition, and plateau phases; slope shows growth rate. Intraspecific interactions: competition reduces access to food, mates, space, or light; cooperation such as social hunting or parental care can increase survival and reproduction. Community: all interacting populations in an ecosystem, with species interdependent inside the abiotic environment. Interspecific relationships: classify herbivory, predation, competition, mutualism, parasitism, and pathogenicity by benefit, harm, consumption, or infection. Mutualism: both species benefit; examples include legumes and Rhizobium, orchids and mycorrhizae, and corals with zooxanthellae. Endemic versus invasive: endemic species are native to a restricted geographic area; invasive species can escape controls and compete with endemic species for niche resources. Testing competition: lab experiments, field observations, and removal studies such as Connell barnacles provide evidence; removal can reveal fundamental versus realized niche. Chi-squared: test association between two species using quadrat presence/absence data, observed and expected counts, degrees of freedom, and critical values. Predator-prey: predator and prey populations regulate each other by density-dependent feedback; snowshoe hare and lynx cycles show prey peaks followed by predator peaks after a time lag. Top-down versus bottom-up: top-down starts with predators or consumers and cascades downward; bottom-up starts with producers or resources and affects higher trophic levels. Allelopathy and antibiotics: allelopathy releases chemicals that inhibit competitor germination or growth; antibiotics such as penicillin from Penicillium are microbial allelochemicals.
Put the C4.1 exam answer frame in order.
OrderUse this for exam questions that combine field sampling, population regulation, graph interpretation, interspecific relationships, statistical association, and ecosystem control.
Use this for exam questions that combine field sampling, population regulation, graph interpretation, interspecific relationships, statistical association, and ecosystem control.
Common loss: naming a method, graph phase, or relationship without explaining the evidence, assumption, or biological consequence.