Psoriasis is a disorder characterized by inflammation of the skin. It causes the formation of red patches (lesional skin), which often have flaky, silver-white surfaces (skin plaques).
Some drugs are available to treat psoriasis. During treatment, the changes in psoriasis severity can be measured by taking daily photographs of the affected region(s) of the body.
In one study, five males of a similar age and with similar psoriasis severity were provided with the same dose of a medicinal drug for seven days. The skin maps show the change in psoriasis severity on the back of one of the males during this study.
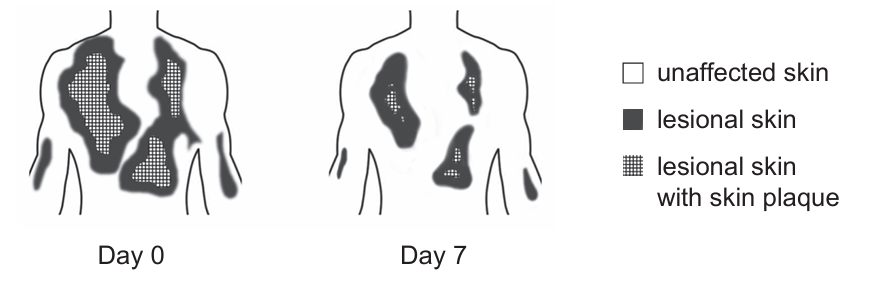
Distinguish between the appearance of the skin of this male on Day 0 and Day 7 of treatment.
Explain how quantitative data could be obtained from all males to assess the success of the treatment.
Comment on the reliability of this investigation.
One drug commonly used to treat psoriasis is called guselkumab. It reduces inflammation in affected regions of skin.
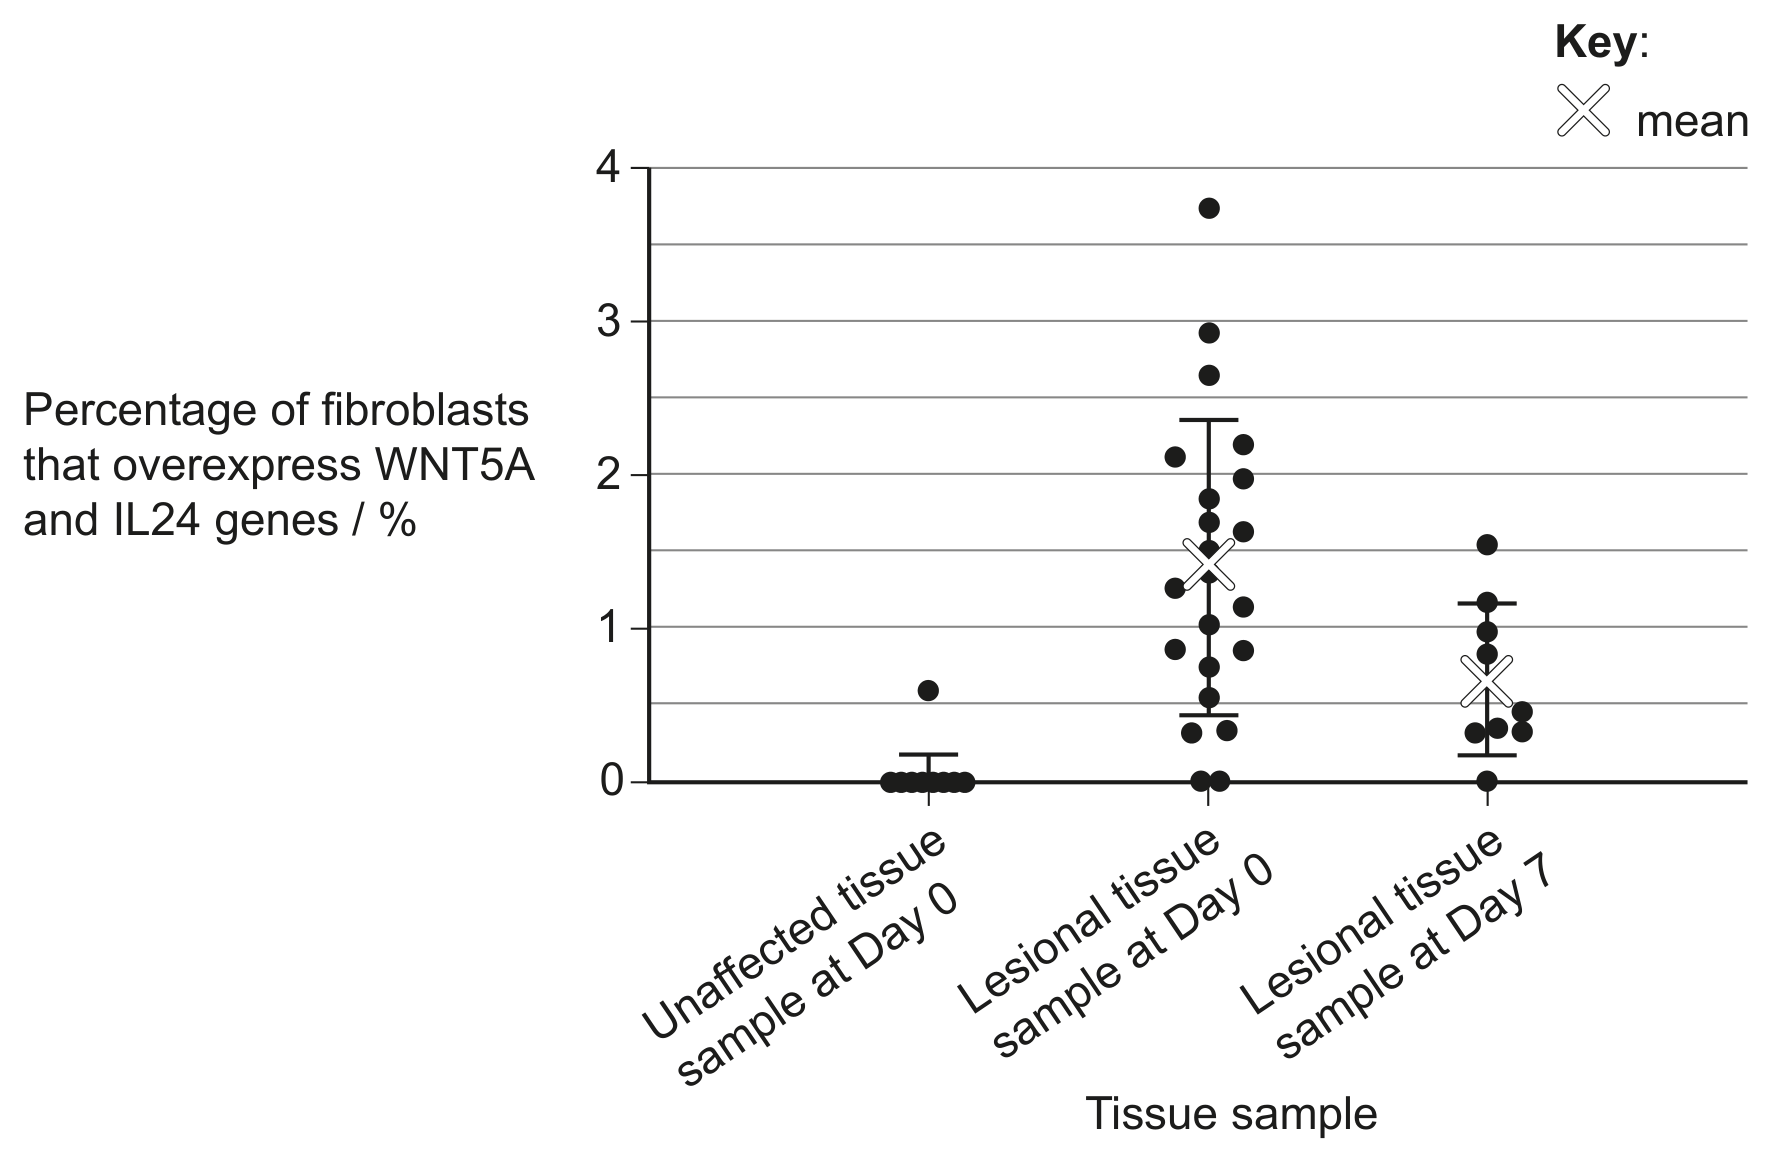
Tissue samples of lesional skin were taken from people with psoriasis before treatment with guselkumab (Day 0) and after one week of treatment (Day 7). Tissue samples of unaffected skin were also taken from these people before treatment with guselkumab. The numbers of samples were different for the three groups.
Skin cells called fibroblasts were extracted from all tissue samples. The scientists measured the expression of two genes that are known to cause inflammation, WNT5A and IL24. They calculated the percentage of fibroblasts that overexpress (express more than normal) both the WNT5A and IL24 genes. The graph shows the data. The crosses on the graph represent mean percentages.
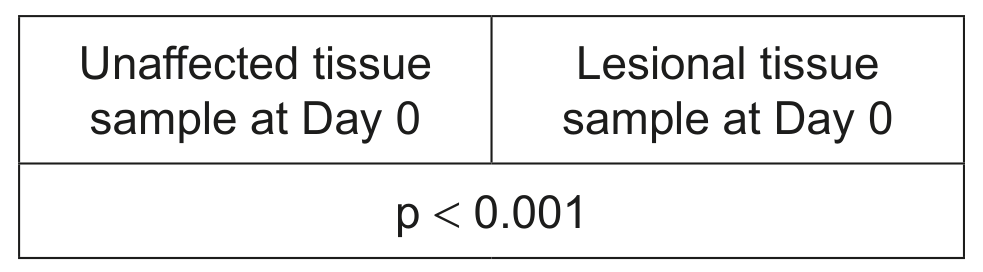
Statistical significance levels
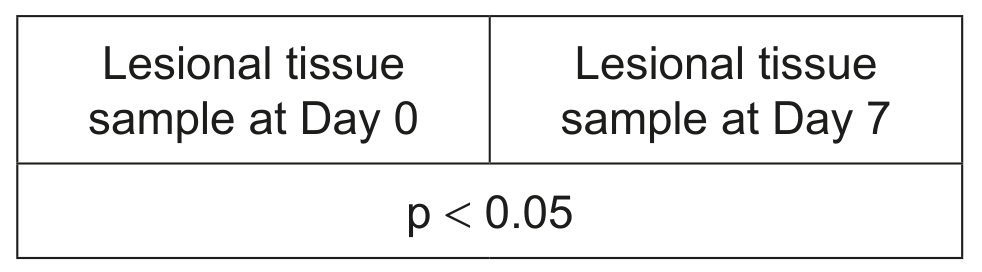
Statistical significance levels
State the highest percentage of fibroblasts that overexpress WNT5A and IL24 in the lesional tissue sample at Day 0.
Calculate the decrease in the mean percentage of fibroblasts in lesional tissue that overexpress WNT5A and IL24 after treatment with guselkumab.
Suggest the reason for including unaffected tissue samples in this investigation.
Explain the conclusions that can be drawn from the data in the graph.