EduNinja
Question rangeC4.2.20—Keeling Curve analysis
[Maximum number: 14]

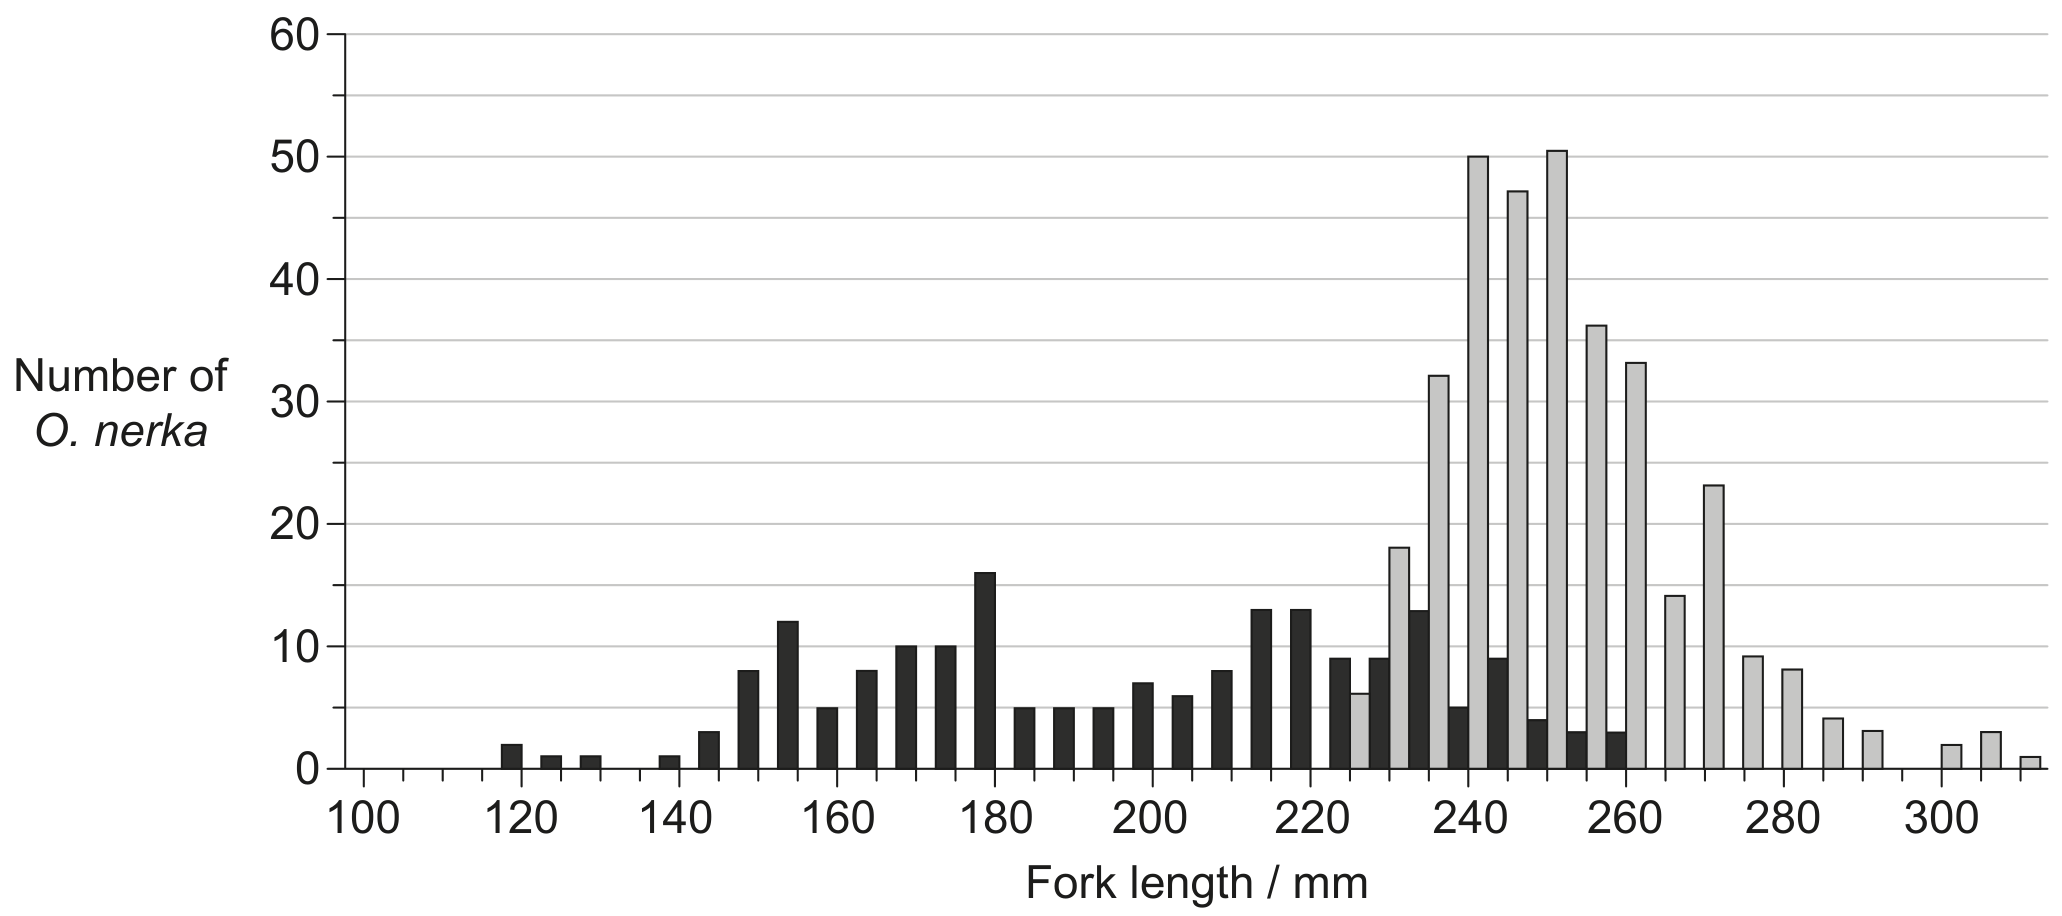
Sockeye salmon (Oncorhynchus nerka) spend the first years of their lives in the freshwater lakes of Alaska before migrating to marine waters. Their first months in marine waters are spent foraging and growing near the shore line. They then move to offshore regions of the North Pacific Ocean for 2 to 3 years.

Question image

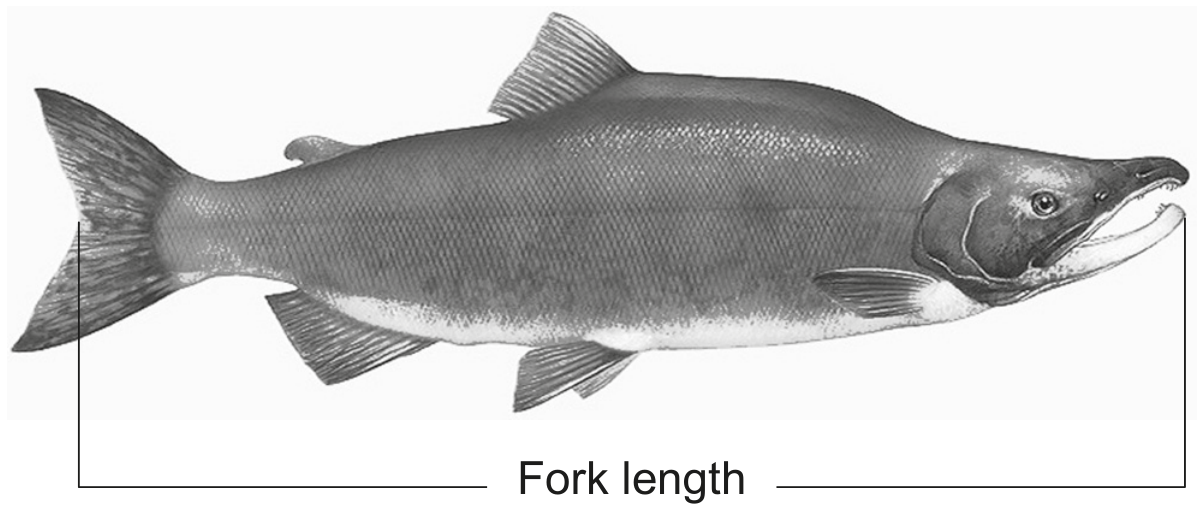
The graph shows fork length frequency of juvenile O. nerka caught during their first months in marine waters in autumn 2008 and ocean age one O. nerka caught 15 months later during winter 2009 in the North Pacific Ocean.

Question image
Table
[Maximum number: 13]

There were widespread and intense wildfires in Southeast Australia during the summer season from November 2019 to January 2020. Estimates have been made of carbon dioxide emissions from these fires based on satellite monitoring data. The bar chart shows estimates made by five different research programmes: GFED, GFAS, QFED, FEER and FINN.

Question image

The table shows other statistics for comparison.

Table

2019-2020 constrained by satellite. Nature (597), pp. 366-369. https://doi.org/10.1038/s41586-021-03712-y.]

[Maximum number: 1]

The table shows the monthly CO2\mathrm{CO}_{2} concentrations in mgL1\mathrm{mgL}^{-1} taken at two monitoring stations.

Table

What is directly indicated by the data?

A

CO2\mathrm{CO}_{2} concentration in the atmosphere varies from place to place.

B

Cape Grim is less affected by global warming than Mauna Loa.

C

CO2\mathrm{CO}_{2} creates a greenhouse effect at both locations.

D

The standard deviation for Cape Grim is higher than standard deviation for Mauna Loa.

[Maximum number: 1]

The graph shows monthly mean atmospheric carbon dioxide concentrations measured at Mauna Loa Observatory, Hawaii in 2020 and 2021.

Question image

Which processes contribute to changes in monthly mean atmospheric carbon dioxide concentrations?

A

Combustion of coal, forest fires, ozone depletion

B

Photosynthesis, respiration, burning of fossil fuels

C

Emissions of carbon dioxide, methane and nitrogen oxides

D

Peat formation, drainage of wetlands, loss of coral reefs

[Maximum number: 1]

What do records from the twentieth and twenty-first century show about the concentration of carbon dioxide in the atmosphere?

A

An upward trend with annual fluctuations

B

An upward trend with no annual fluctuations

C

Annual fluctuations but no overall trend

D

Random fluctuations and no overall trend

[Maximum number: 1]

The table shows the monthly CO2\mathrm{CO}_{2} concentrations in mgL1\mathrm{mgL}^{-1} taken at two monitoring stations.

Table

What is directly indicated by the data?

A

CO2\mathrm{CO}_{2} concentration in the atmosphere varies from place to place.

B

Cape Grim is less affected by global warming than Mauna Loa.

C

CO2\mathrm{CO}_{2} creates a greenhouse effect at both locations.

D

The standard deviation for Cape Grim is higher than standard deviation for Mauna Loa.

[Maximum number: 1]

The graph shows data collected at Mauna Loa, USA, for monthly mean carbon dioxide concentration.

Question image

What causes the decreases in monthly mean carbon dioxide concentration each year?

A

Combustion increases.

B

Respiration increases.

C

Decomposition increases.

D

Photosynthesis increases.

The chart shows the use of glyphosate and other herbicides on soybeans (Glycine max) grown in the US from 1998 to 2011. Also shown is the trend for the environmental impact quotient (EIQ) which is calculated from the toxicity of herbicides to wildlife and to humans, their persistence in the environment and their other ecological effects.

Question image
[Maximum number: 7]

The Laysan Albatross (Phoebastria immutabilis) sometimes ingests plastic. A bolus is a pellet made of material that the albatross cannot digest, so brings it back up from its stomach to its mouth and then ejects the indigestible matter. Graph A indicates the mass of indigestible natural material, such as bones and octopus beaks, in the bolus of birds at two different locations. Graph B indicates the mass of plastic in the bolus at both locations.

Question image
0