EduNinja
Question rangeA1.2.8—Complementary base pairing
[Maximum number: 8]

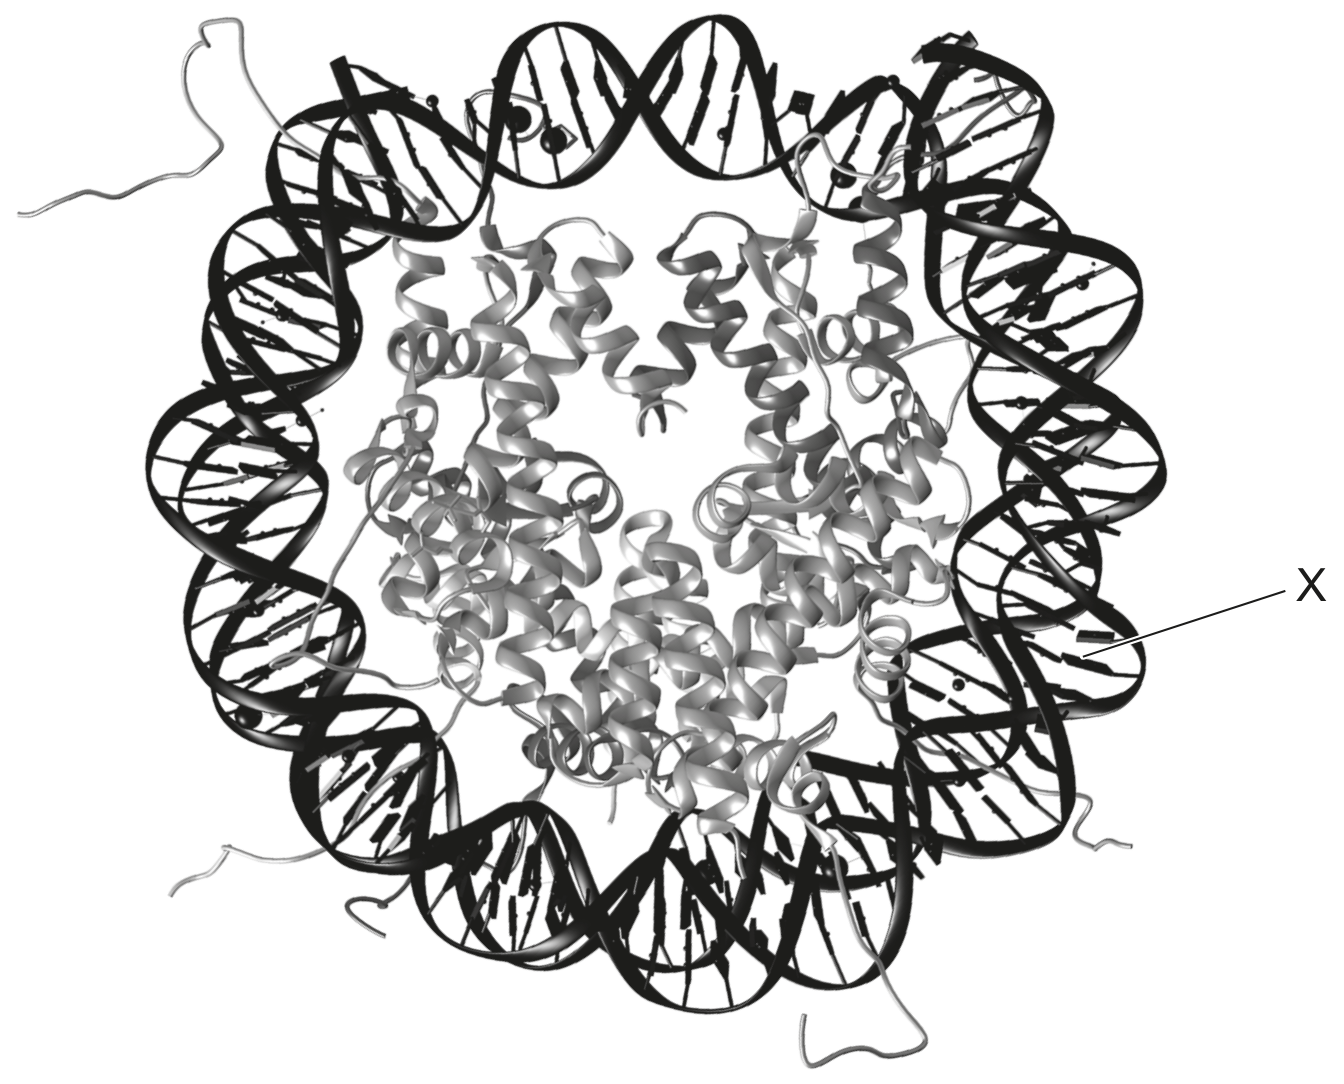
The image of a nucleosome was obtained using molecular visualization software.

Question image
(a)
(i)

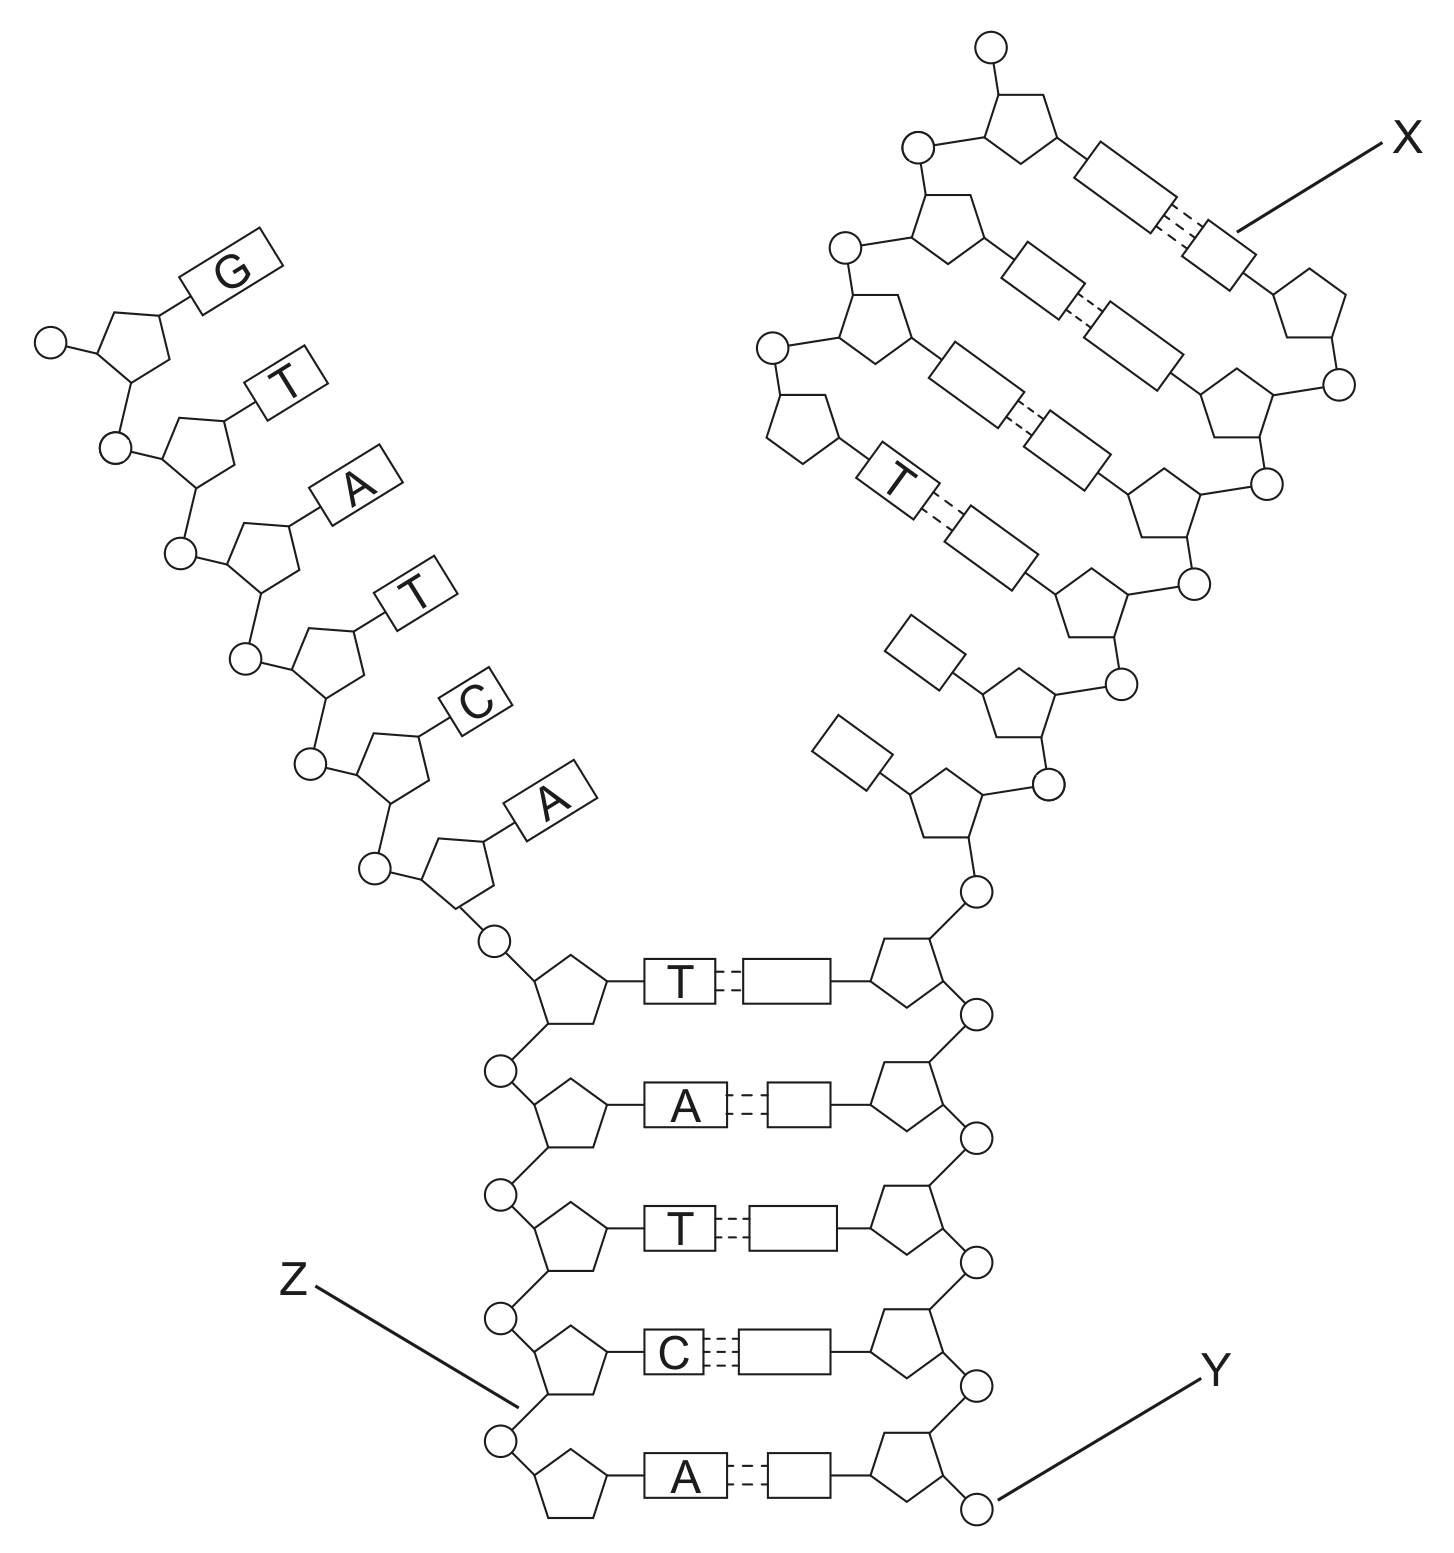
Adenine forms hydrogen bonds with the nitrogenous base X . Identify X .

[ 1 ]
(ii)

Suggest one benefit and one disadvantage of using molecular visualization.

Benefit:

Disadvantage:

[ 2 ]
(b)

Describe the structure of the nucleosome.

[ 3 ]
(c)

Explain how methylation of nucleosomes affects DNA transcription.

[ 2 ]
[Maximum number: 1]

What do DNA replication, transcription and translation have in common?

A

Take place in cell nucleus

B

Require free nucleotides

C

Catalysed by polymerase

D

Complementary base pairing

[Maximum number: 1]

The percentage of thymine in the DNA of an organism is approximately 30 %. What is the percentage of guanine?

A

70 %

B

30 %

C

40 %

D

20 %

The following diagram shows a short stretch of DNA. What bases are indicated by labels Y and Z ?

Question image

Y

Z

thymine

adenine

thymine

guanine

uracil

guanine

uracil

adenine

[Maximum number: 7]

The diagram shows a nucleic acid, with some of the bases indicated.

Question image
(a)

Identify the type of nucleic acid shown in the diagram.

[ 1 ]
(b)

Determine with a reason whether the diagram shows transcription or replication.

[ 1 ]
(c)

Deduce the base indicated by X on the diagram.

[ 1 ]
(d)

Identify the terminal indicated by Y on the diagram.

[ 1 ]
(e)
(i)

Identify the type of bond indicated by Z on the diagram.

[ 1 ]
(ii)

Several enzymes can catalyse the formation of this type of bond. Explain how two enzymes catalyse it during the process shown in the diagram.

[ 2 ]
[Maximum number: 8]

The graph shows a sigmoid population growth curve.

Question image
(a)

Identify the phases labelled X and Y .
X :
Y:

[ 1 ]
(b)

Outline how fossil records can provide evidence for evolution.

[ 2 ]
(c)

The table summarizes the genome size of several organisms.

Table
[ 3 ]
(i)

Distinguish between the terms genotype and phenotype.

[ 1 ]
(ii)

Outline a structural difference between the chromosomes of Helicobacter pylori and Homo sapiens.

[ 1 ]
(iii)

Deduce the percentage of adenine in Oryza sativa if the proportion of guanine in that organism is 30 %.

[ 1 ]
(d)

The figure shows a pedigree chart for the blood groups of three generations.

Question image
[ 2 ]
(i)

Deduce the possible phenotypes of individual X .

[ 1 ]
(ii)

Describe ABO blood groups as an example of codominance.

[ 1 ]
0